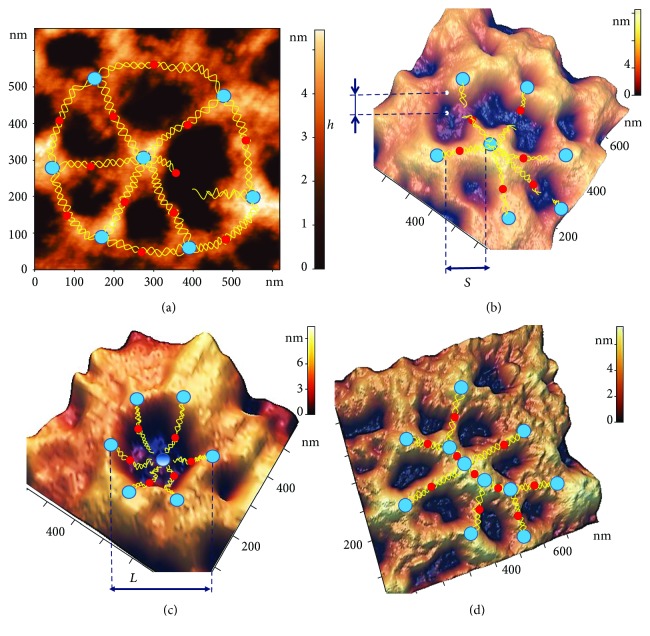
Figure 4.
Examples of typical local nanodefects in the spectrin network. (a) AFM 2D image, 660 × 660 nm2, of a basic spectrin matrix element, with a broken ankyrin (red) connection. (b) AFM 3D image, 700 × 700 nm2, of a spectrin network element with three distorted ankyrin connections. (c) AFM 3D image, 600 × 600 nm2, of a spectrin matrix element, in which the connection between six spectrin filaments (yellow lines) and an actin complex (blue) is broken, resulting in the formation of a local topological crater-like dip. (d) AFM 3D image, 800 × 800 nm2, of a spectrin network element showing clustering of protein complexes.

