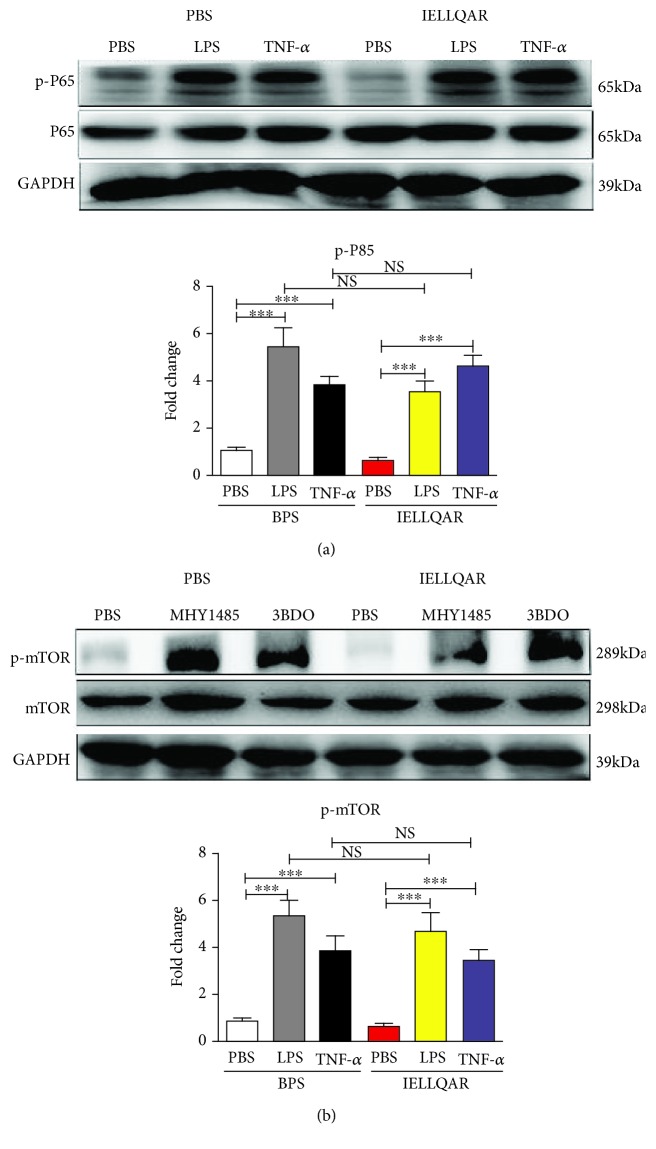
Figure 8.
IELLQAR failed to directly inhibit the NF-κB and mTOR pathways. (a) PBMCs were treated with 1 μg/ml LPS or 100 ng/mL TNF-α in the presence or absence of IELLQAR for 30 min. Representative Western blots showing the expression levels of total and phosphorylated P65. (b) PBMCs were treated with 2 μM MHY1485 or 60 μM 3BDO in the presence or absence of IELLQAR for 30 min. Representative Western blots showing the expression levels of total and phosphorylated mTOR. The intensities of the protein bands were quantified and are presented as the ratio of phosphorylated protein/total protein after normalization to GAPDH. Data are presented as the mean ± SEM (n = 3). ∗p < 0.05, ∗∗p < 0.01, and ∗∗∗p < 0.001.

