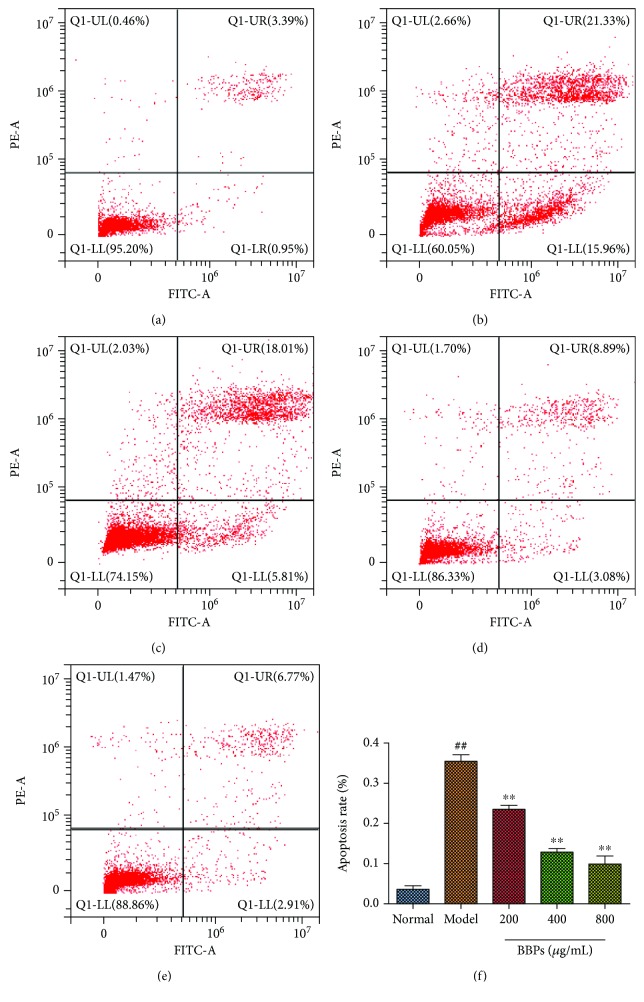
Figure 4.
Effects of BBPs on H2O2-stimulated apoptosis of PC12 cells. (a) Normal group. (b) Model group. (c) 200 μg/mL of BBP group. (d) 400 μg/mL of BBP group. (e) 800 μg/mL of BBP group. (f) Apoptosis rate of different groups. PC12 cells were treated with BBPs at concentrations of 200, 400, and 800 μg/mL for 24 h, subsequently subjected to H2O2 at the concentration of 300 μmol/L for 4 h. Cell apoptosis was detected by the flow cytometry assay. BBPs: protein extracts in Bombyx batryticatus. The values represent mean ± SD (n = 3). ##P < 0.01 vs. the normal group; ∗∗P < 0.01 vs. the model group.

