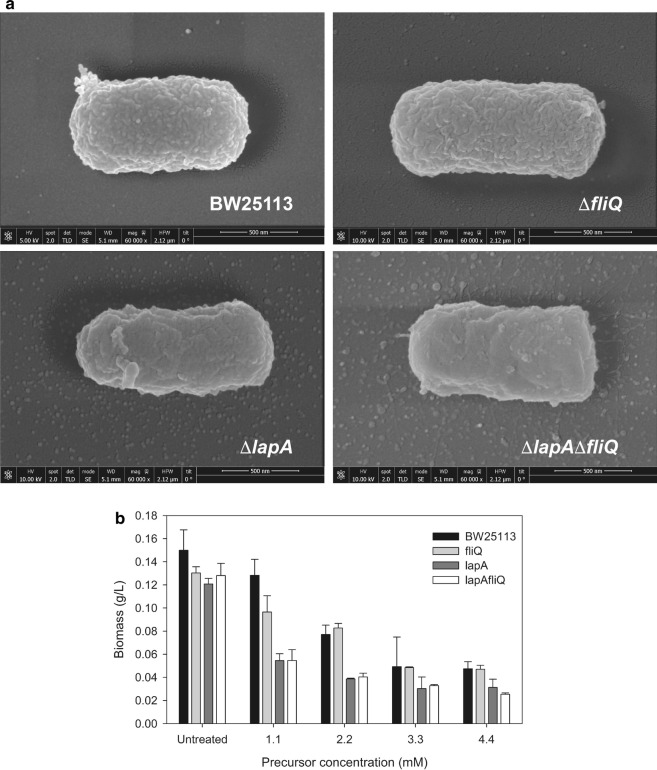
Fig. 4.
SEM micrographs of E. coli strains and tolerance test at 6 h in presence or absence of different concentrations of precursor. a SEM images for the wild type, the selected mutants and the double mutant strains overexpressing NfsB. b Growth tolerance test of the genetic backgrounds of these strains (without pBAD-NfsB) in presence of increasing concentrations of precursor

