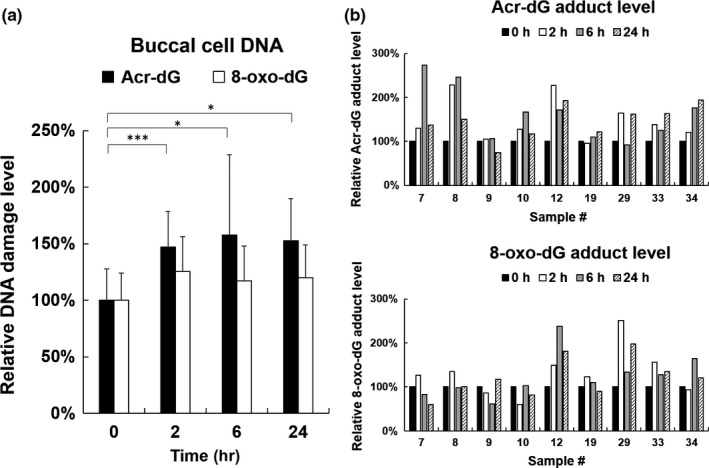
Figure 3.

Slot blot analysis of Acr‐dG and 8‐oxo‐dG adducts in buccal DNA of control subjects after consuming one meal of fried food at different times. (A) Relative Acr‐dG adduct or 8‐oxo‐dG adduct levels in buccal cells of Study 3 (N = 9). Bar graphs of data collected from two independent slot blot experiments. Data were presented as the mean ± SD. Student's t tests were used to determine statistical significance, and two‐tailed p‐values are shown. *p < 0.05, ***p < 0.005. (B) Relative Acr‐dG adduct level (upper panel) and 8‐oxo‐dG adduct level (lower panel) in buccal cells of individual control subjects (N = 9) from Study 3
