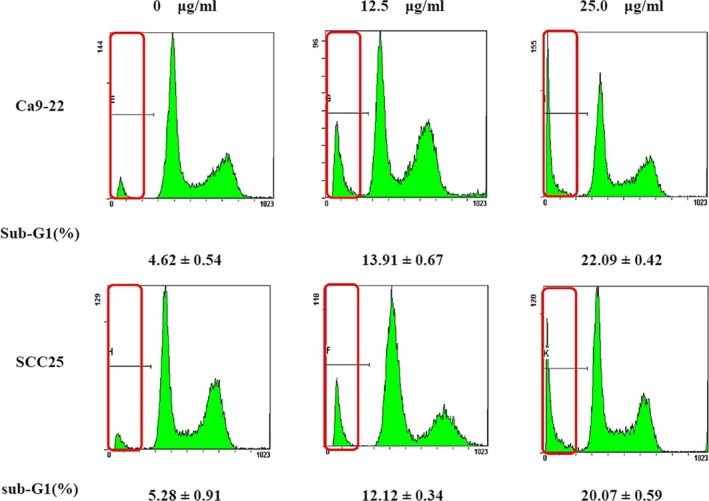
Figure 7.

Kinetic analysis of the effects of bromelain (BR) treatment on cell cycle progression in Ca9‐22 and SCC25 cells, and induction of apoptosis, using flow cytometry. Ca9‐22 and SCC25 cells were treated with 0, 12.5, and 25.0 μg/ml BR for 24 hr. Flow cytometry histograms show the distribution of cells in different phases of the cell cycle and the number of cells (y‐axis) versus the DNA content (x‐axis). Values below are mean percentages (±SD) of sub‐G1 stage cells (n = 3)
