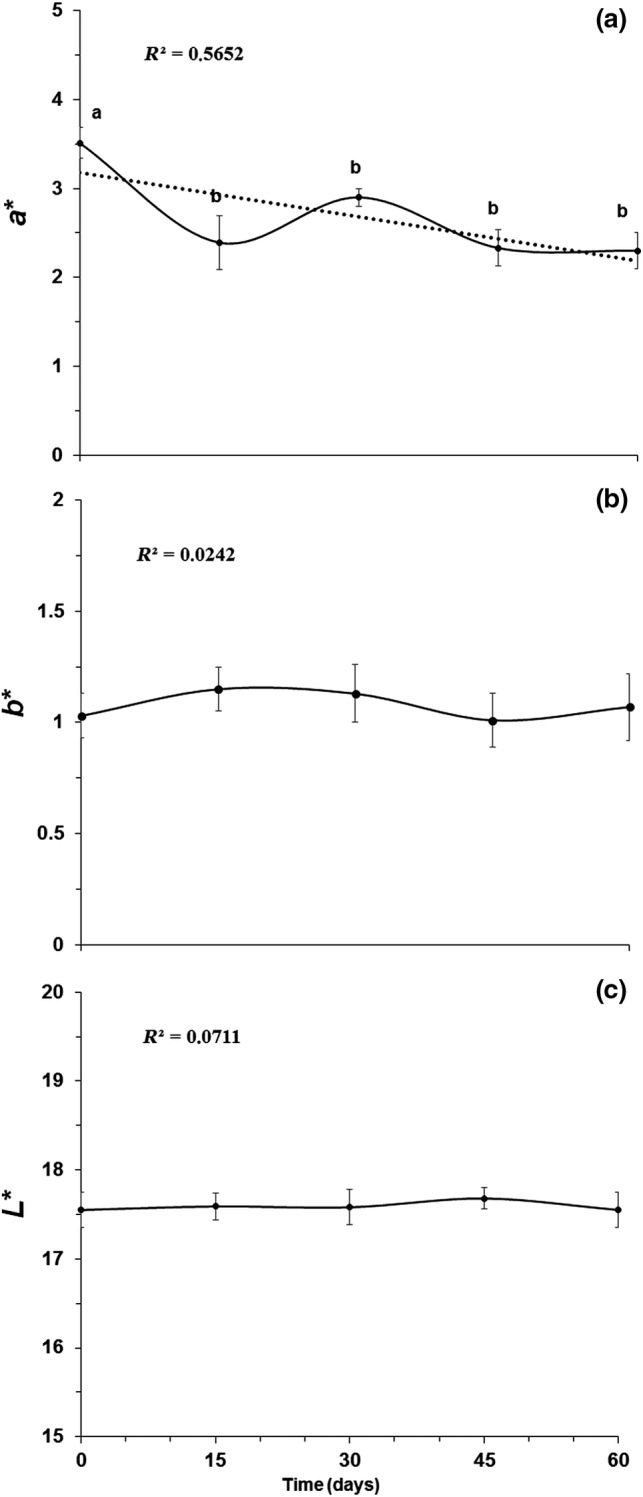
Figure 2.

Evaluation of the three‐dimensional color coordinates a* (A), b* (B), and L* (C) during storage of the jam prepared from grape peel dried extract. ‡The values (means ± SE) correspond to averages from three replicates. Different letters in the same line indicate significant differences between the values (P < 0.05)
