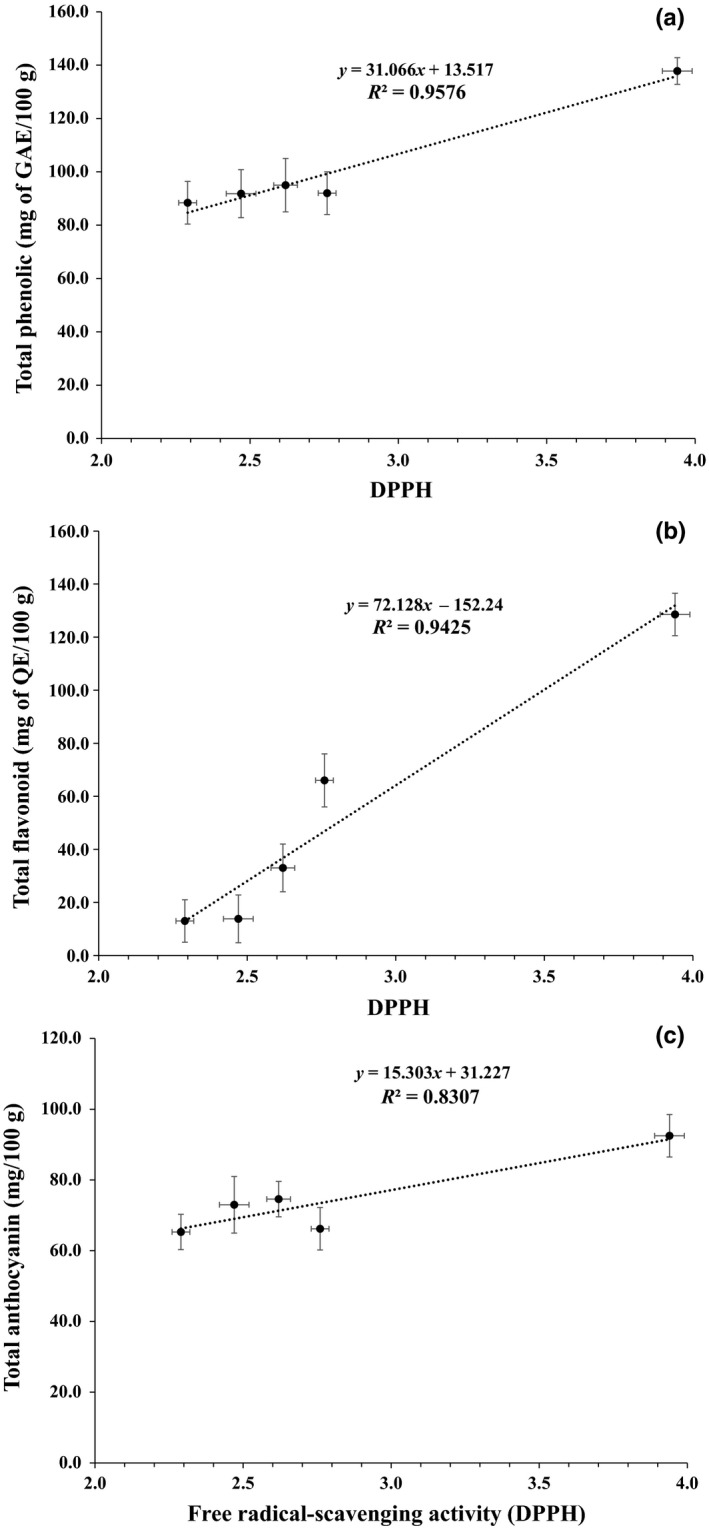
Figure 4.

Correlation between the bioactive compound contents (total phenolic (a), flavonoid (b), and anthocyanin (c) concentrations) and the DPPH results. ‡The values (means ± SE) correspond to averages from three replicates. Different letters in the same line indicate significant differences between the values (p < 0.05)
