
Figure 5.
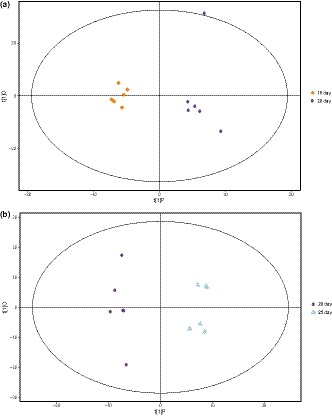
(a) Orthogonal partial least squares‐discriminant analysis (OPLS‐DA) score plot of the samples with 15 and 20 days of fermentation; (b) OPLS‐DA score plot of the samples with 20 and 25 days of fermentation
Official websites use .gov
A
.gov website belongs to an official
government organization in the United States.
Secure .gov websites use HTTPS
A lock (
) or https:// means you've safely
connected to the .gov website. Share sensitive
information only on official, secure websites.
(a) Orthogonal partial least squares‐discriminant analysis (OPLS‐DA) score plot of the samples with 15 and 20 days of fermentation; (b) OPLS‐DA score plot of the samples with 20 and 25 days of fermentation