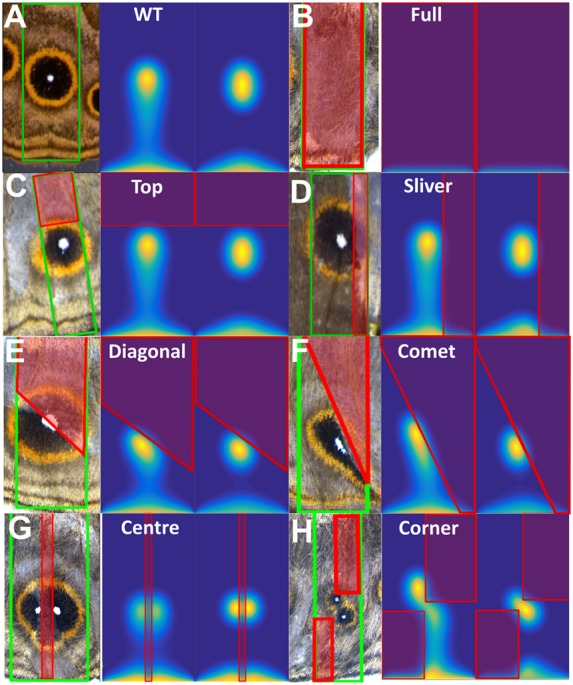
Fig. 4.

Reaction-diffusion simulations of wing sectors where part of the sector has no ‘activator’ function. (A-H) For each panel, left image shows the experimental data. The right shows the in silico results after 72 h and 144 h, orientation of compartment and parameters are the same as in Fig. 3A. The region inside the red boxes in each image (except in A), represent the Dll mutant region, where K=0. The region contoured in green corresponds to the wing cell contours. See text for description of each phenotype. See Fig. S12 to see how red and green contours are defined. WT, wild type. See Movies 1 and 2 for examples of detailed dynamics for A and G.
