Fig. 2.
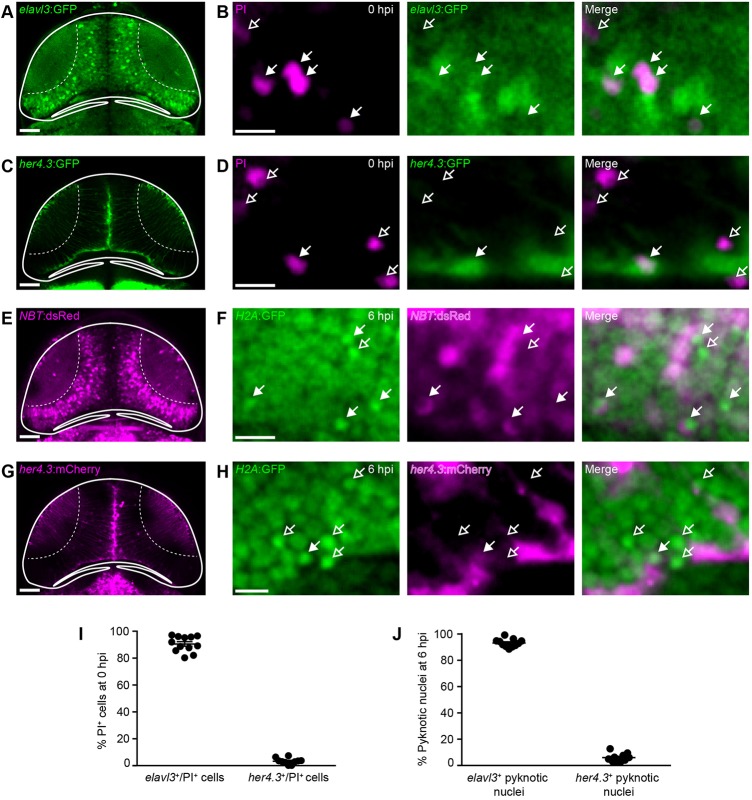
The majority of cells dying after brain injury are neurons. (A,C,E,G) Confocal images of the optic tectum of the neuronal reporter lines elavl3:GFP (A) and NBT:dsRed (E), and the radial glia reporter lines her4.3:GFP (C) and her4.3:mCherry (G). Scale bars: 50 µm. (B,D,F,H) Live imaging of PI+ cells in elavl3:GFP (B) or her4.3:GFP (D) animals at 0 hpi, and of pyknotic nuclei in NBT:dsRed;H2A:GFP (F) or her4.3:mCherry;H2A:GFP (H) animals at 6 hpi. Filled and empty arrows indicate colocalisation, or lack thereof, of cell death and cell type markers, respectively. Scale bars: 5 µm. (I,J) Quantification of elavl3+/PI+ and her4.3+/PI+ cells at 0 hpi (I) and of NBT+ and her4.3+ pyknotic nuclei at 6 hpi (J). n≥10 animals per experimental group. Each circle represents one set of results. Data are mean±s.e.m.

