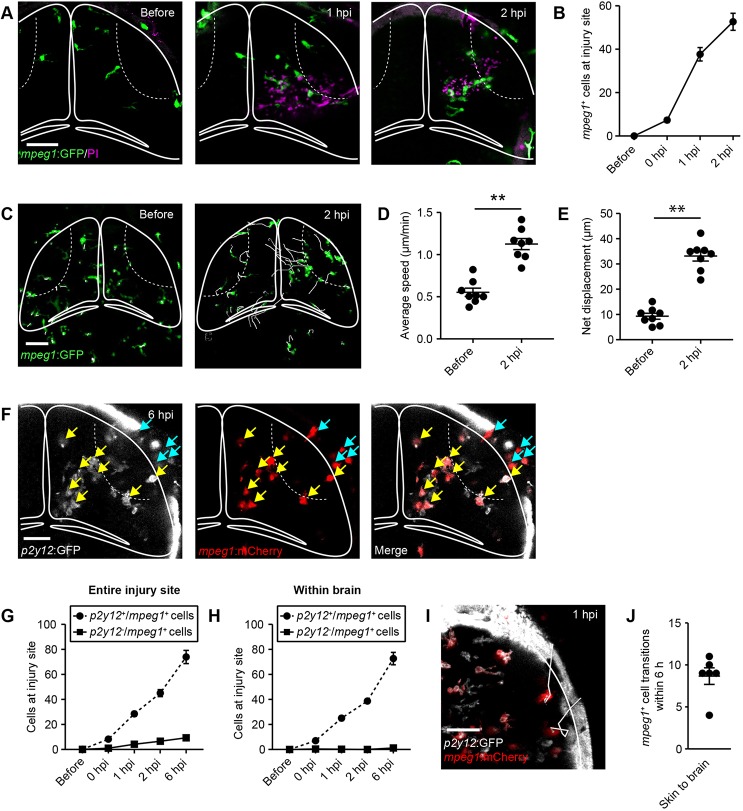
Fig. 4.
Microglia and skin macrophages rapidly migrate to the injury site, but skin macrophages rarely enter the brain. (A) Live imaging of the microglia/macrophage reporter line mpeg1:GFP at different time points after injury. Scale bar: 50 µm. (B) Quantification of mpeg1+ cells at the injury site within the brain. n=6 animals per experimental group. (C) Traces visualising cell body displacement of mpeg1+ cells for 30 min before injury or in the 2 h after injury, in maximum intensity projections of z-stacks of the optic tectum. Scale bar: 50 µm. (D,E) Quantification of migration speed (D) and net displacement (E) of mpeg1+ cell bodies before and after injury. n=8 animals per experimental group. **P<0.01 using Student's t-test. (F) Confocal images of the optic tectum of a p2y12:GFP;mpeg1:mCherry animal at 6 hpi. Yellow arrows indicate p2y12+/mpeg1+ cells. Light-blue arrows indicate p2y12−/mpeg1+ cells. Scale bar: 40 µm. (G,H) Quantification of p2y12+/mpeg1+ and p2y12−/mpeg1+ cells at the entire injury site (G) or within the brain (H). n=12 animals per experimental group. (I) Traces visualising cell body displacement of mpeg1+ skin macrophages in the hour after injury in a p2y12:GFP;mpeg1:mCherry animal in a maximum intensity projection of a z-stack of the optic tectum. Scale bar: 40 µm. (J) Quantification of the number of transitions of mpeg1+ skin macrophages into the brain in p2y12:GFP;mpeg1:mCherry animals within 6 h of injury. n=6 animals. Data are mean±s.e.m.

