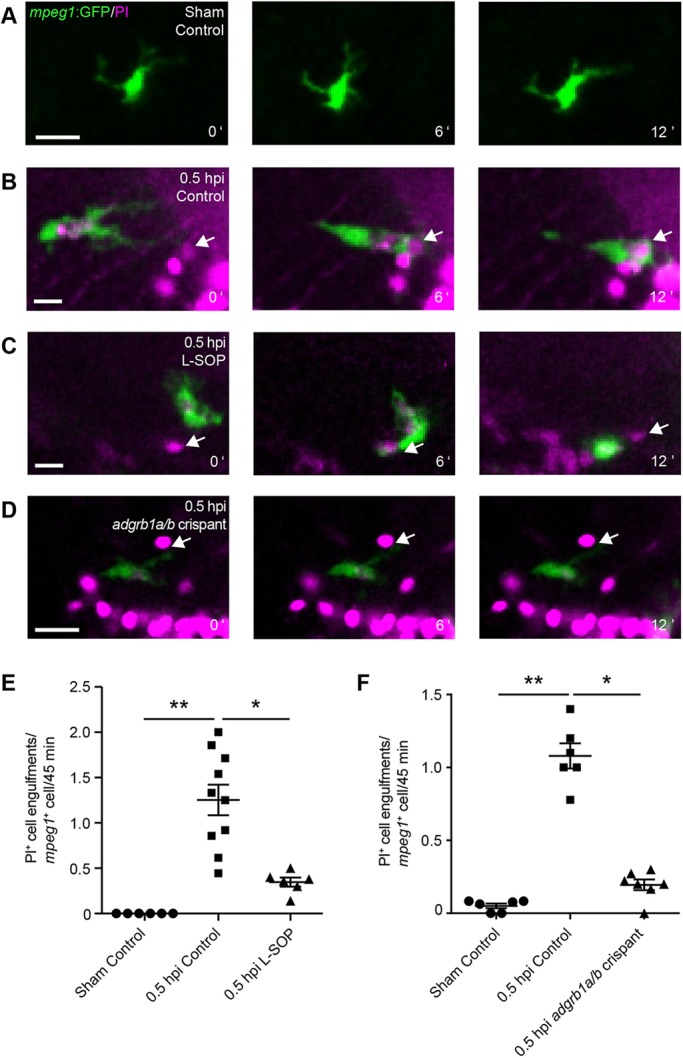
Fig. 5.

Microglia rapidly phagocytose PI+ cells after injury. (A-D) Time-lapse imaging of microglial phagocytosis in mpeg1:GFP larvae in a sham animal (A), an injured animal (B), an injured animal treated with L-SOP (C) and an injured adgrb1a/b crispant (D). White arrows indicate PI+ cells. Scale bars: 15 µm. (E,F) Quantification of phagocytosis of PI+ cells per mpeg1+ cell from 30 to 75 min after injury in animals treated with L-SOP (E) or in adgrb1a/b crispants (F). Control animals were treated with vehicle (E) or uninjected (F). n≥6 animals per experimental group. *P<0.05 and **P<0.01 using Kruskal–Wallis test with Dunn's post-hoc test. Data are mean±s.e.m.
