
Figure 3.
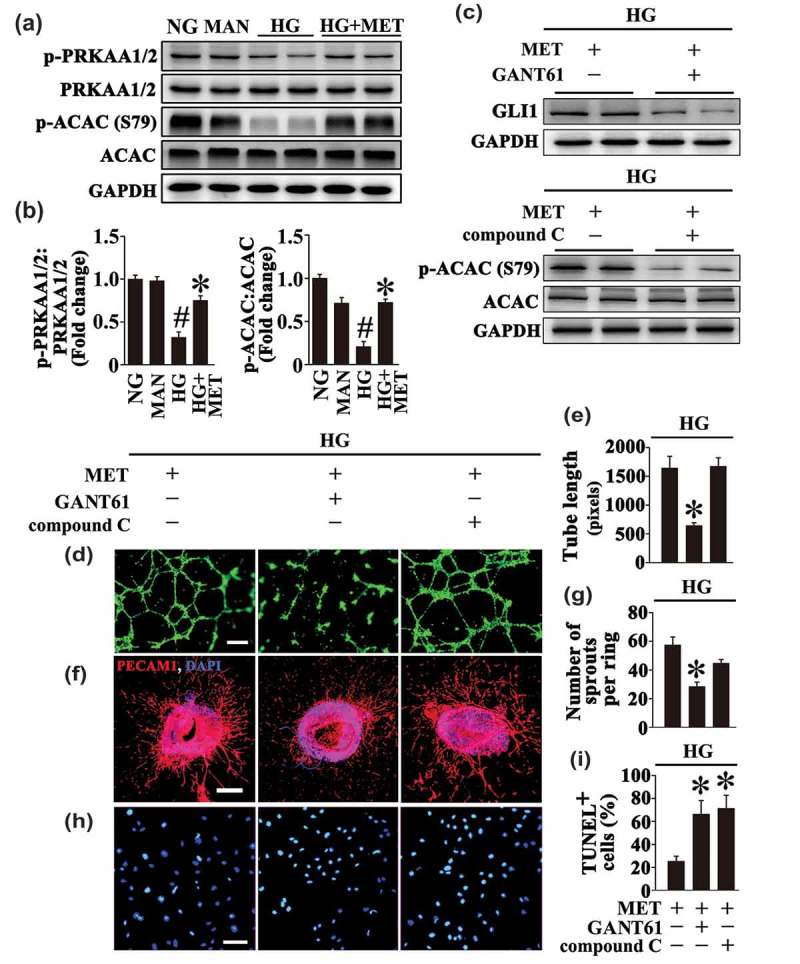
The metformin-mediated endothelial protective action against HG is Hh dependent. (a) Cell lysates of HUVECs were used to detect the phospho- (p-) PRKAA1/2:total PRKAA1/2 ratio and p-ACAC:total ACAC ratio by immunoblotting. HUVECs were cultured either in NG or HG medium in the presence or absence of MET (50 μM) for 72 h, MAN was used as the osmotic control for HG. (b) The quantitative analysis of p-PRKAA1/2 and p-ACAC relative to corresponding total proteins in (a). Data are expressed as fold change relative to NG, values displayed are means ± SEM of 6 independent experiments. # P < 0.05 vs. NG or MAN; * P < 0.05 vs. HG. (c) Immunoblotting analysis of GLI1 and p-ACAC:total ACAC ratio. HUVECs were maintained in HG in the presence of MET (50 μM) for 72 h. For signaling pathway analysis, compound C (10 μM) or GANT61 (20 μM) were given as pretreatments for 2 h every day before MET administration. (d) Capillary-like tube formation was assessed by matrigel angiogenesis assay in HUVECs. HUVECs were treated as in (c). Scale bars: 300 μm. (e) Quantification of the tube length in (d), images of tube morphology were taken in 6 random microscopy fields per sample and values displayed are means ± SEM of 8 independent experiments. * P < 0.05 vs. HUVECs exposed to HG in combination with MET. (f) Representative confocal images of aortic rings from C57BL/6 mice. The rings were cultured in HG in combination of MET (50 μM). For signaling pathway analysis, Compound C (10 μM) or GANT61 (20 μM) were given as pretreatments for 2 h every day before MET administration. Scale bars: 500 μm. (g) Quantification of the number of sprouts in (f), values displayed are means ± SEM of 10 independent experiments. * P < 0.05 vs. rings exposed to HG in combination with MET. (h) TUNEL assay of HUVECs. HUVECs were treated as indicated in (c), the apoptotic cells were labelled with green, and nuclei were stained with DAPI (blue). Scale bars: 100 μm. (i) The quantitative analysis of TUNEL+ cells in at least 6 separate fields, values displayed are means ± SEM of 6 independent experiments. * P < 0.05 vs. HUVECs exposed to HG in combination with MET.