
Figure 4.
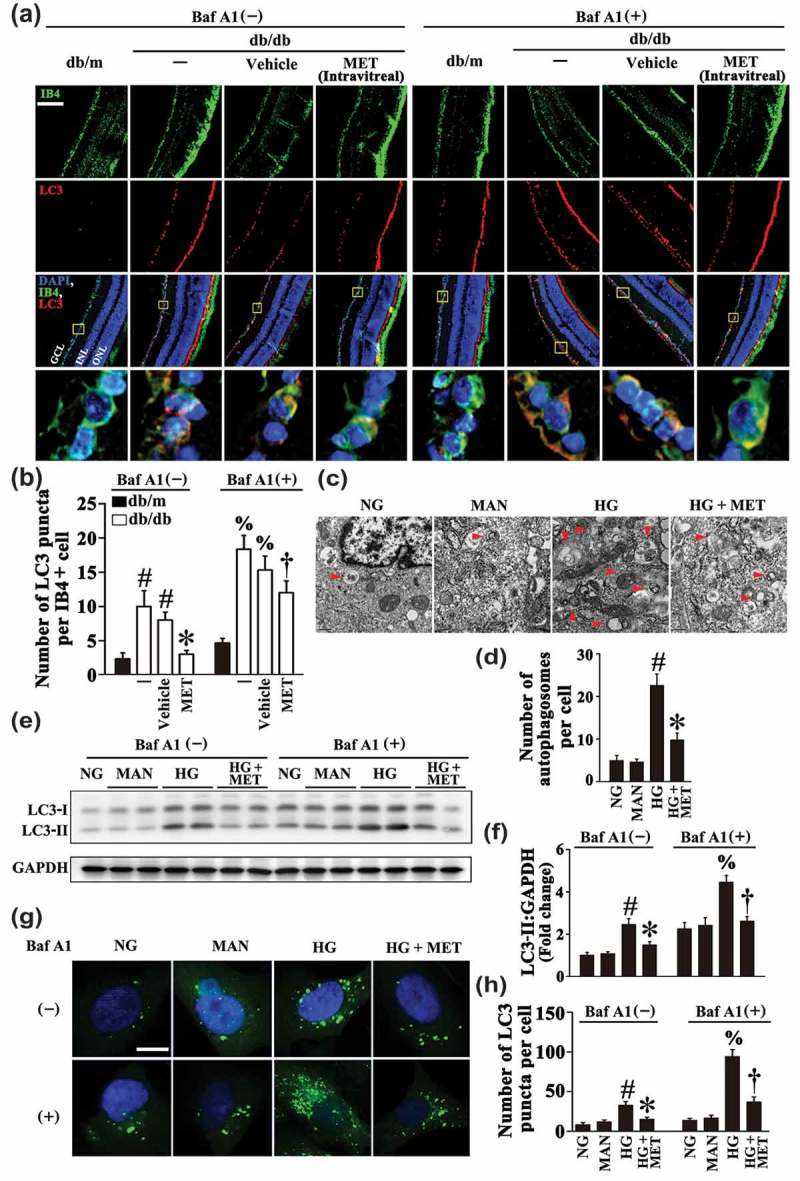
Metformin downregulates hyperglycemia-activated autophagy. (a) Representative immunofluorescence analysis of LC3 (red puncta) in the retinas from db/m mice, db/db mice, and intravitreal MET-treated (0.5 nmol in 1 μL) db/db mice. Where indicated, mice were intraperitoneally treated with bafilomycin A1 (BafA1, 0.3 mg/kg). The IB4 staining (green) highlights retinal vasculature, and nuclei were stained with DAPI (blue). GCL, ganglion cell layer; INL, inner nuclear layer; ONL, outer nuclear layer. Scale bars: 100 μm. (b) Quantification represents the average number of LC3 puncta per IB4+ cell. Images were taken in 6 random microscopy fields per sample and values displayed are means ± SEM of 8 independent experiments. # P < 0.05 vs. db/m mice; * P < 0.05 vs. db/db mice or vehicle-treated db/db mice; % P < 0.05 vs. db/m mice in the presence of BafA1; and † P < 0.05 vs. db/db mice or vehicle-treated db/db mice in the presence of BafA1. (c) Representative electron micrographs from HUVECs cultured in vitro demonstrate the presence of double-membrane autophagosomes (arrows). HUVECs were cultured either in NG or HG medium in the presence or absence of MET (50 μM) for 72 h, MAN was used as the osmotic control for HG. Scale bars: 0.5 μm. (d) Quantification of the autophagosomes per cell in HUVECs treated as in (c). Values displayed are means ± SEM of 6 independent experiments. # P < 0.05 vs. NG or MAN; * P < 0.05 vs. HG. (e) Cell lysates of HUVECs treated as indicated in (c) were used to detect the LC3-II protein levels by immunoblotting. Where indicated, BafA1 (400 nM) was added for the last 4 h. (f) The quantitative analysis of LC3-II protein level relative to GAPDH protein level in (e). Data are expressed as fold change relative to NG, values displayed are means ± SEM of 6 independent experiments. # P < 0.05 vs. NG or MAN; * P < 0.05 vs. HG; % P < 0.05 vs. NG or MAN in the presence of BafA1; and † P < 0.05 vs. HG in the presence of BafA1. (g) Representative confocal images of HUVECs transduced with Ad-GFP-LC3B. HUVECs were treated as indicated in (c). Where indicated, BafA1 (400 nM) was added for the last 4 h. Scale bars: 5 μm. (h) Quantification of the GFP puncta per cell in HUVECs treated as in (g). Values displayed are means ± SEM of 10 independent experiments. # P < 0.05 vs. NG or MAN; * P < 0.05 vs. HG; % P < 0.05 vs. NG or MAN in the presence of BafA1; and † P < 0.05 vs. HG in the presence of BafA1.