
Figure 5.
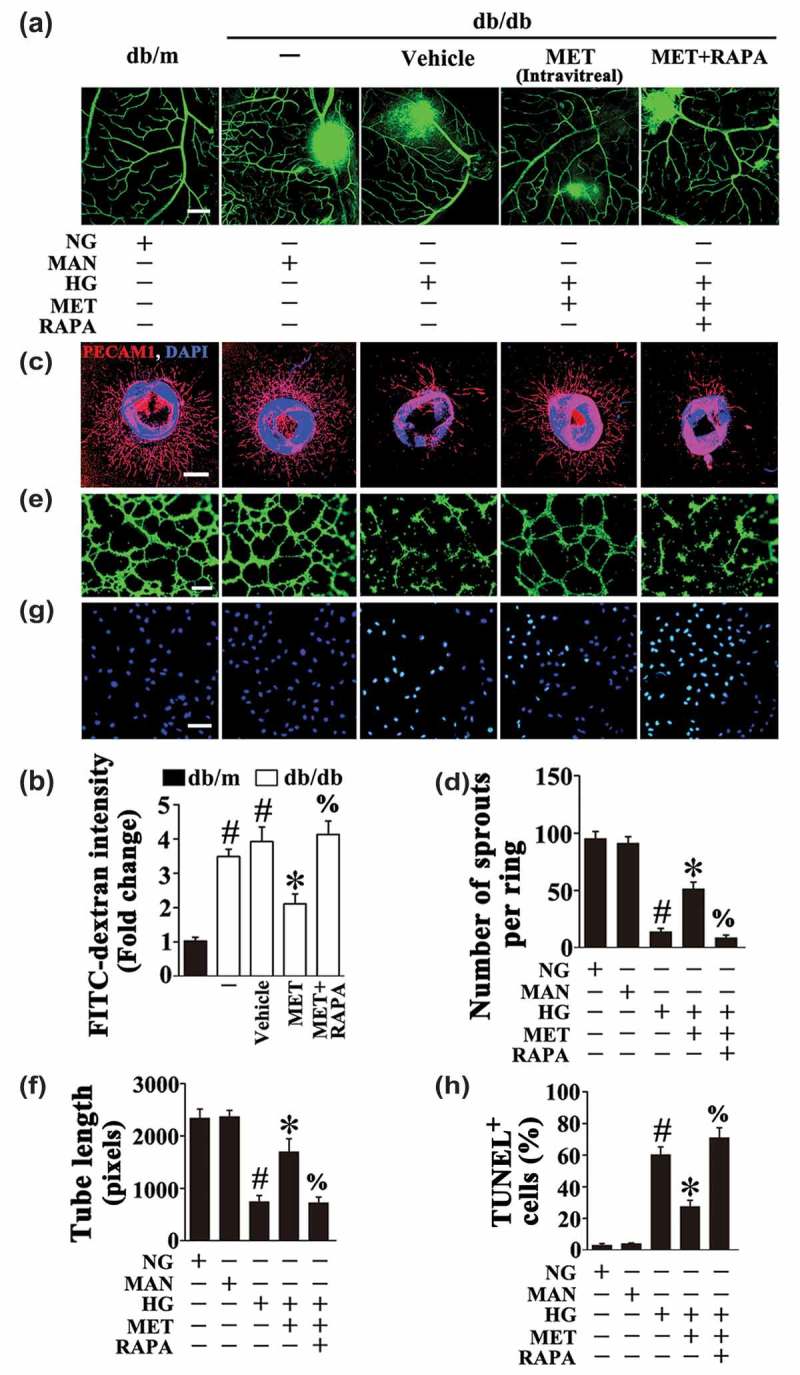
Autophagy activation abolished the metformin-mediated protective effect on hyperglycemia-induced endothelial injury. (a) Representative confocal images of vascular leakage in retinas from db/m mice, db/db mice, and intravitreal MET-treated (0.5 nmol in 1 μL) db/db mice. Rapamycin (RAPA) was injected (i.p. 7.5 mg/kg) right after MET intravitreal injection. Scale bars: 200 μm. (b) Retinal leakage was quantified by measuring the fluorescence intensities of FITC-dextran in (a). Images were taken in 6 random microscopy fields per sample and values displayed are means ± SEM of 8 independent experiments. Data are expressed as fold change relative to db/m mice. # P < 0.05 vs. db/m mice; * P < 0.05 vs. db/db mice or vehicle-treated db/db mice; % P < 0.05 vs. MET intravitreally injected db/db mice. (c) Representative confocal images of aortic rings from C57BL/6 mice cultured in different media containing NG, HG alone or with MET (50 μM) for 72 h, MAN was used as the osmotic control for HG. For pharmacological manipulation of autophagy, aortic rings were treated with RAPA (10 nM) 2 h after MET treatment. Scale bars: 500 μm. (d) Quantification of the number of sprouts in (c), values displayed are means ± SEM of 10 independent experiments. # P < 0.05 vs. NG or MAN; * P < 0.05 vs. HG; % P < 0.05 vs. HG coincubated with MET. (e) Capillary-like tube formation was assessed by matrigel angiogenesis assay in HUVECs. HUVECs were cultured either in NG or HG medium in the presence or absence of MET (50 μM) for 72 h, MAN was used as the osmotic control for HG. For pharmacological manipulation of autophagy, HUVECs were treated with RAPA (10 nM) 2 h after MET treatment. Scale bars: 300 μm. (f) Quantification of the tube length in (e), images of tube morphology were taken in 6 random microscopy fields per sample and values displayed are means ± SEM of 8 independent experiments. # P < 0.05 vs. NG or MAN; * P < 0.05 vs. HG; % P < 0.05 vs. HG coincubated with MET. (g) TUNEL assay of HUVECs treated as indicated in (e). The apoptotic cells were labelled with green, and nuclei were stained with DAPI (blue). Scale bars: 100 μm. (h) The quantitative analysis of TUNEL+ cells in at least 6 separate fields, values displayed are means ± SEM of 6 independent experiments. # P < 0.05 vs. NG or MAN; * P < 0.05 vs. HG; % P < 0.05 vs. HG coincubated with MET.