
Figure 7.
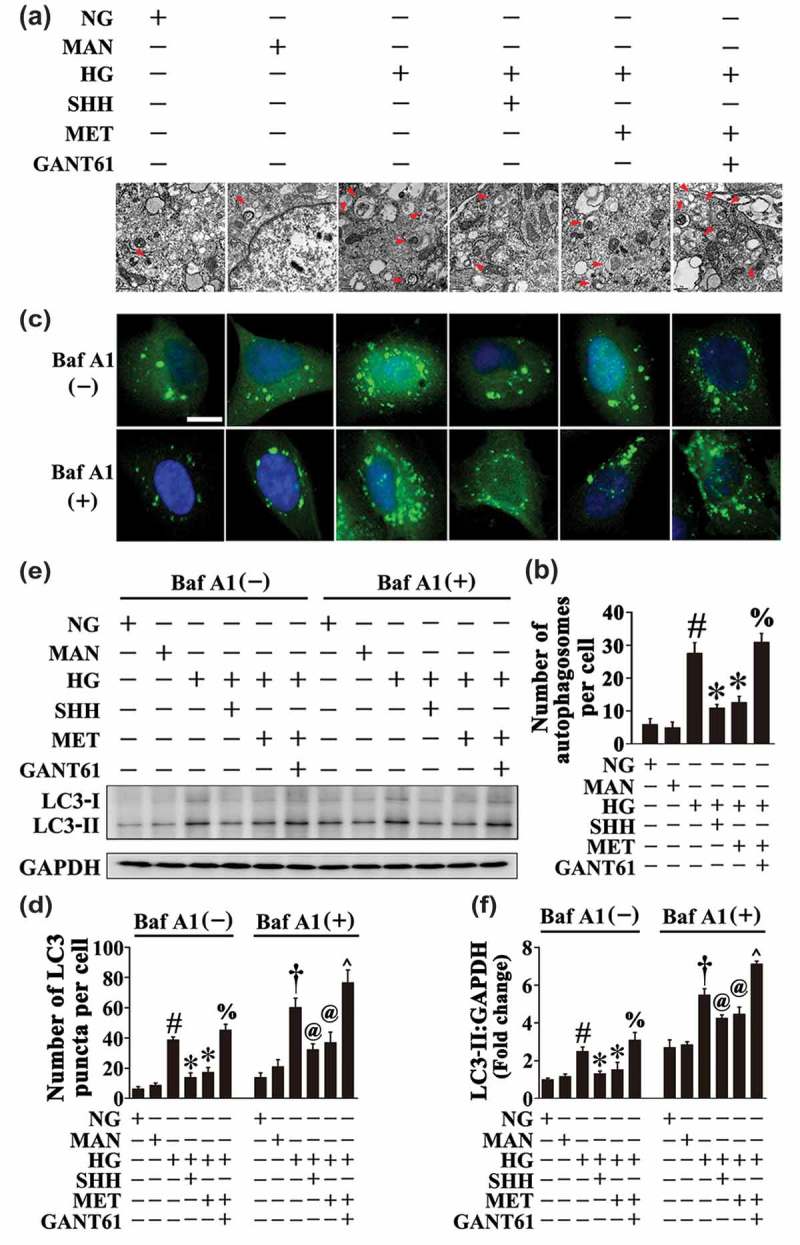
Metformin downregulates hyperglycemia-triggered autophagy via activation of the Hh pathway. (a) Representative electron micrographs from HUVECs cultured in vitro demonstrate the presence of double-membrane autophagosomes (arrows). HUVECs were cultured either in NG or HG medium in the presence or absence of MET (50 μM) for 72 h, MAN was used as the osmotic control for HG. For manipulation of the Hh pathway, HUVECs were cultured in HG medium coincubated with SHH (10 μg mL−1). GANT61 (20 μM) was given as pretreatment for 2 h every day before MET administration. Scale bars: 0.5 μm. (b) Quantification of the autophagosomes per cell in HUVECs treated as in (a). Values displayed are means ± SEM of 6 independent experiments. # P < 0.05 vs. NG or MAN; * P < 0.05 vs. HG; % P < 0.05 vs. HG coincubated with MET. (c) Representative confocal images of HUVECs transduced with Ad-GFP-LC3B. HUVECs were treated as in (a). Where indicated, BafA1 (400 nM) was added for the last 4 h. Scale bars: 5 μm. (d) Quantification of the GFP puncta per cell in (c). Values displayed are means ± SEM of 10 independent experiments. # P < 0.05 vs. NG or MAN; * P < 0.05 vs. HG; % P < 0.05 vs. HG coincubated with MET; and † P < 0.05 vs. NG or MAN in the presence of BafA1; @ P < 0.05 vs. HG in the presence of BafA1; ^ P < 0.05 vs. HG coincubated with MET in the presence of BafA1. (e) Cell lysates of HUVECs treated as indicated in (c) were used to detect the LC3-II protein levels by immunoblotting. (f) The quantitative analysis of LC3-II protein level relative to GAPDH protein level. Data are expressed as fold change relative to NG, values displayed are means ± SEM of 6 independent experiments. # P < 0.05 vs. NG or MAN; * P < 0.05 vs. HG; % P < 0.05 vs. HG coincubated with MET; and † P < 0.05 vs. NG or MAN in the presence of BafA1; @ P < 0.05 vs. HG in the presence of BafA1; ^ P < 0.05 vs. HG coincubated with MET in the presence of BafA1.