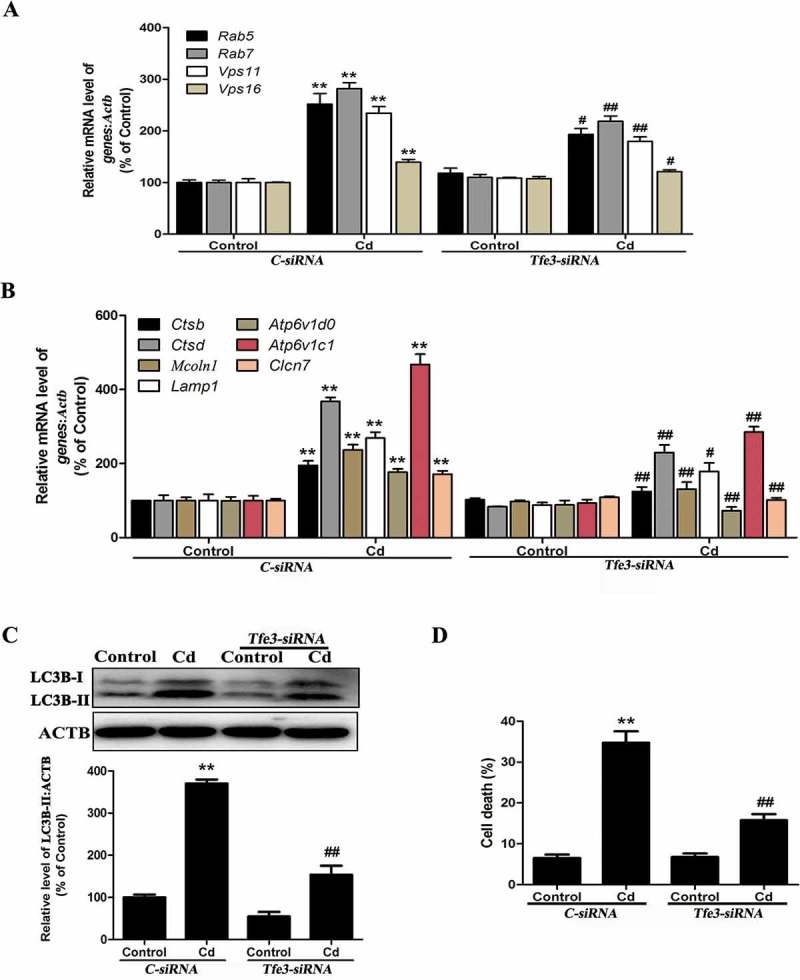
Figure 4.

The TFE3 pathway in Cd-induced autophagy in MSCs. (a-b) MSCs were treated with the siRNA for Tfe3 or the control and then incubated with 14 μM Cd for another 24 h. The mRNA levels of TFE3-target genes were then measured. (c) MSCs transfected with either control siRNA or Tfe3 siRNA were grown with or without Cd (14 μM) for 24 h. The LC3B-II level was determined by western blot. ACTB was the internal standard for protein loading. (d) MSCs transfected with either control siRNA or Tfe3 siRNA were grown with or without Cd (14 μM) for 24 h. Cell death was determined by trypan blue. The results are expressed as the percentage of the control, which was set to 100%. The values are presented as the means ± SEM, **P < 0.01 versus the control group, #P < 0.05, ##P < 0.01 versus the control-siRNA+ Cd (14 μM) group. (n = 4).
