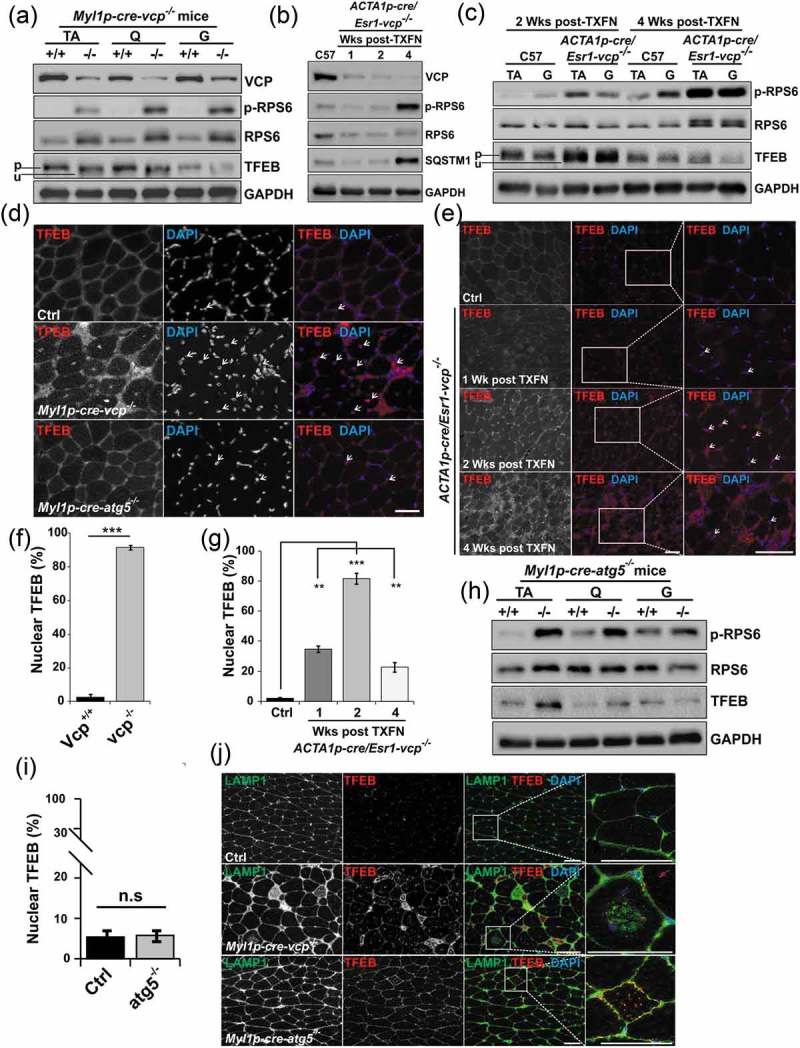
Figure 6.

TFEB activation is an early feature of VCP inactivation in muscle degeneration. (a) Immunoblot of lysates from TA, quadriceps or gastrocnemius muscle of 6-week-old control (+/+) or Myl1p-cre-vcp-/- (-/-) mice using antibodies to VCP, p-RPS6, RPS6, TFEB or GAPDH. Lines adjacent to TFEB denote the higher migrating phosphorylated form (p) and the faster migrating unphosphorylated form (u). (b) Immunoblot of lysates from TA of age matched control or ACTA1p-cre/Esr1-vcp-/- mice after 1, 2 and 4 wk post tamoxifen injection for 5 d using antibodies to VCP, p-RPS6, RPS6, SQSTM1 or GAPDH. (c) Immunoblot of lysates from tibialis anterior or gastrocnemius muscle of age matched control or ACTA1p-cre/Esr1-vcp-/- mice after 2 and 4 wk post tamoxifen injection for 5 d using antibodies to p-RPS6, RPS6, TFEB or GAPDH. Lines adjacent to TFEB denote the higher migrating phosphorylated form (p) and the faster migrating unphosphorylated form (u). (d) Immunofluorescence with an antibody to TFEB on TA muscle from 6-week-old control, Myl1p-cre-vcp-/-, and 9-week-old Myl1p-cre-atg5-/-mice. Arrows point to nuclear-localized TFEB. (e) Immunofluorescence with an antibody to TFEB on TA muscle from age-matched control or ACTA1p-cre/Esr1-vcp-/- mice after 1, 2 and 4 wk post tamoxifen injection for 5 d. Arrows point to nuclear localized TFEB. (f) Bar graph of the percentage of TFEB-positive nuclei in muscle from 6-week-old control (+/+) and Myl1p-cre-vcp-/- (-/-) mice. Quantification was performed by counting the number of nuclei stained with TFEB in control (+/+) and Myl1p-cre-vcp-/- (-/-) mice using ImageJ software. At least 198 nuclei were counted per condition using 3 different mice. Comparison between groups was performed by paired Student t-test. (g) Bar graph of the percentage of TFEB-positive nuclei in muscle from control or ACTA1p-cre/Esr1-vcp-/- mice after 1, 2 and 4 wk post tamoxifen injection for 5 d. Quantification was performed by counting the number of nuclei stained with TFEB using ImageJ software. At least 236 nuclei were counted per condition from 3 different mice. Comparison between groups was performed using a paired Student t-test. (h) Immunoblot of lysates from tibialis anterior, quadriceps or gastrocnemius muscle of 9-week-old control or Myl1p-cre-atg5-/- mice using antibodies to p-RPS6, RPS6, TFEB or GAPDH. (i) Bar graph of the percentage of TFEB-positive nuclei in muscle from 9-week-old control and Myl1p-cre-atg5-/- mice. Quantification was performed by counting the number of nuclei stained with TFEB using ImageJ software. At least 1293 nuclei were counted per condition from 3 different mice. Comparison between groups was performed by paired Student t-test. (j) Co-immunofluorescence of LAMP1 and TFEB in control, Myl1p-cre-atg5-/-, or Myl1p-cre-vcp-/- mouse muscle. *p < 0.05; **p < 0.01; ***p < 0.001; n.s., not significant. DAPI (blue) stains nuclei. Scale: 100 μm.
