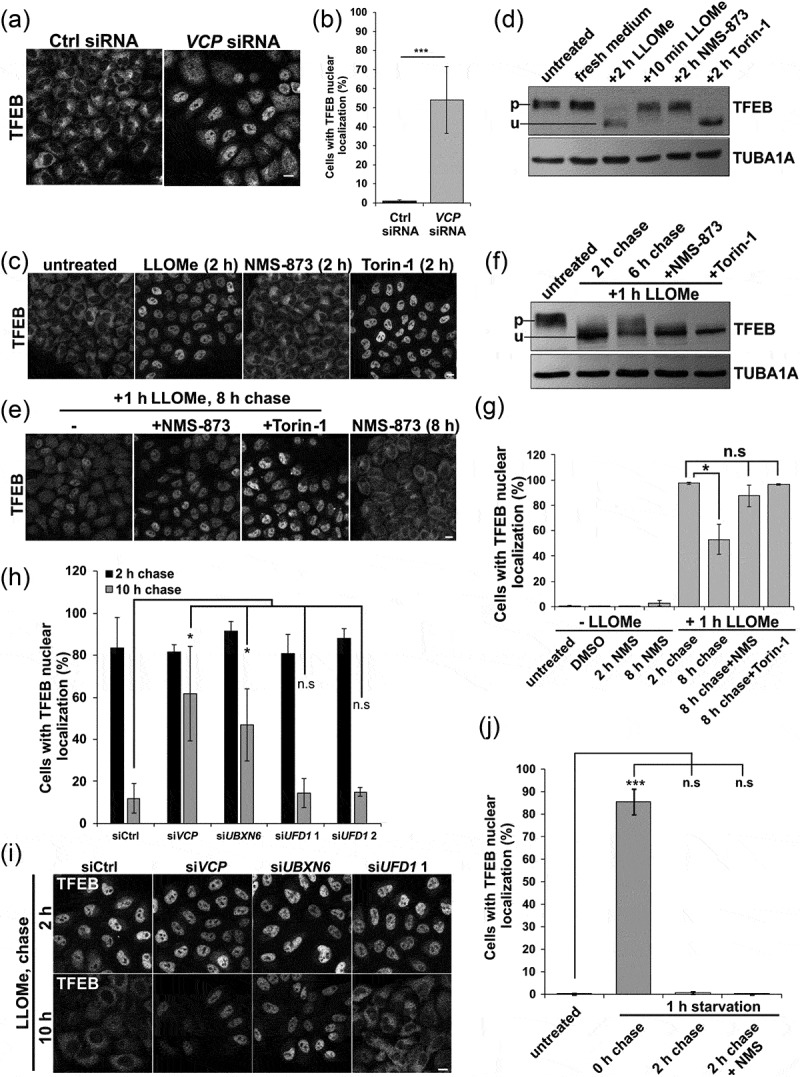
Figure 7.

Inhibition of VCP and ELDR components lead to TFEB nuclear persistence following LMP. (a) TFEB immunolocalization in HeLa cells following control or VCP siRNA treatment for 48 h. (b) Bar graph of the percentage of TFEB-positive nuclei in HeLa cells following control or Vcp siRNA treatment. At least 249 cells were counted per condition and experiment. (c) TFEB immunolocalization from cells treated with LLOMe, NMS-873 or Torin-1 for 2 h. (d) Immunoblot for TFEB or TUBA1A/alpha-tubulin from HeLa cells treated with LLOMe, NMS-873 or Torin-1 for the indicated times. Lines adjacent to TFEB denote the higher migrating phosphorylated form (p) and the faster migrating unphosphorylated form (u). (e) TFEB immunolocalization from HeLa cells treated with LLOMe for one hour and allowed to recovery in the absence of LLOMe for 8 h. In some cases, cells were also incubated with NMS-873 or Torin-1 during recovery. (f) Immunoblot for TFEB or TUBA1A/α-tubulin from HeLa cells treated with LLOMe for 2 h or 1 h and then allowed to recover in the absence of LLOMe for 6 h. In some cases, cells were also incubated with NMS-873 or Torin-1 during recovery. Lines adjacent to TFEB denote the higher migrating phosphorylated form (p) and the faster migrating unphosphorylated form (u). (g) Bar graph of the percentage of cells with TFEB-positive nuclei from conditions in C and E. At least 644 cells were counted per condition and experiment. (h) Bar graph of the percentage of cells with TFEB-positive nuclei following control or VCP, YOD1, UBXN6, PLAA or UFD1 siRNA knockdown following 1 h of treatment with LLOMe and subsequent chase with media lacking LLOMe for 2 or 10 h. At least 251 cells were counted per condition and experiment. (i) TFEB immunolocalization in HeLa cells with control or VCP, UBXN6 or UFD1 siRNA knockdown following 1 h of treatment with LLOMe and subsequent chase with media lacking LLOMe for the 2 or 10 h. (j) Bar graph of TFEB-positive nuclei following 1 h of nutrient starvation and 2 h recovery nutrient-rich media with and without NMS-873. At least 631 cells were counted per condition and experiment. *p < 0.05; ***p < 0.001; n.s., not significant. Automated quantification with N = 3. Scale: 1 μm.
