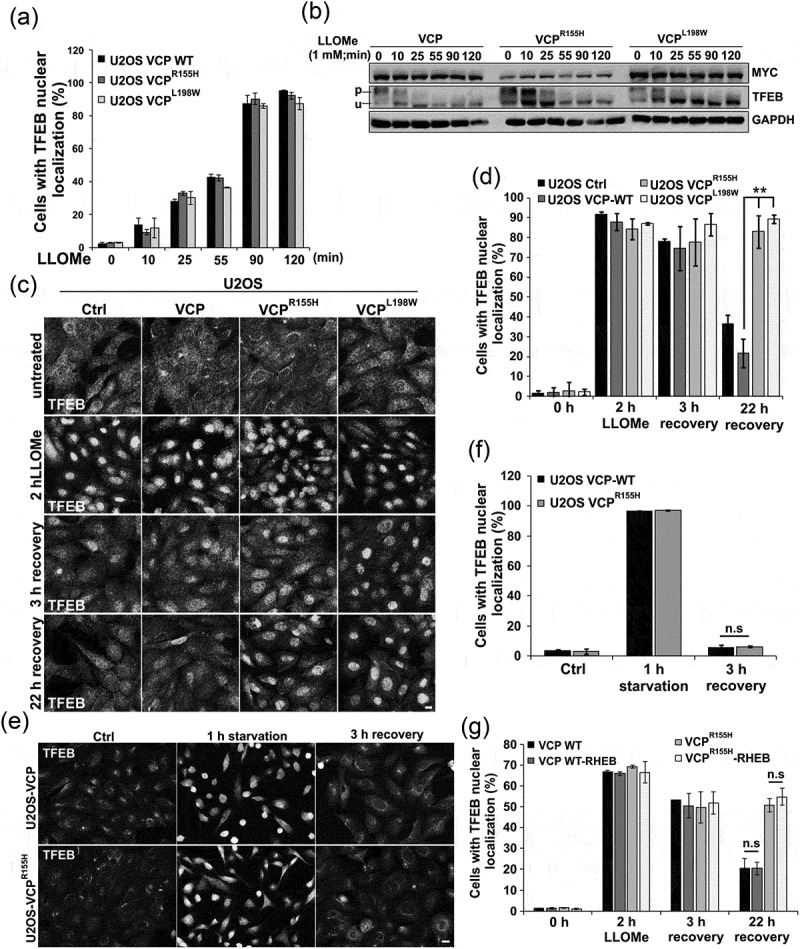
Figure 8.

VCP mutant expression leads to TFEB nuclear persistence following LMP. (a) Bar graph of TFEB-positive nuclei following LLOMe treatment in VCP WT and 2 VCP disease mutant (VCPR155H or VCPL198W)-expressing cells. Quantification was performed by counting the number of cells with nuclear TFEB localization using ImageJ software. At least 304 cells were counted per group and condition. Comparison between groups was performed by paired Student t-test. (b) Immunoblot of lysates from U2OS cells stably expressing VCP WT, VCPR155H or VCPL198W following LLOMe treatment for the indicated times. Lines adjacent to TFEB denote the higher migrating phosphorylated form (p) and the faster migrating unphosphorylated form (u). (c) TFEB immunolocalization in U2OS cells expressing control, VCP WT or 1 of 2 VCP mutations following 2 h of treatment with LLOMe and subsequent chase with media lacking LLOMe for the 3 or 22 h. (d) Bar graph of TFEB-positive nuclei following LLOMe treatment and recovery in VCP WT- and mutant-expressing cells. Quantification was performed by counting the number of cells with nuclear TFEB localization using ImageJ software. At least 100 cells were counted per group and condition. Comparison between groups was performed by paired Student t-test. (e) TFEB immunolocalization in U2OS cells expressing control, VCP WT or VCPR155H following 1 h of nutrient starvation and subsequent chase with media containing serum and amino acids for 3 h. (f) Bar graph of TFEB-positive nuclei following starvation and recovery in VCP WT- and VCPR155H mutant-expressing U2OS cells. Quantification was performed by counting the number of cells with nuclear TFEB localization using ImageJ software. At least 568 cells were counted per group and condition. Comparison between groups was performed by paired Student t-test. (g) Bar graph of TFEB-positive nuclei following LLOMe treatment and recovery in VCP WT- and mutant-expressing U2OS cells with or without constitutively active RHEB. Quantification was performed by counting the number of cells with nuclear TFEB localization using ImageJ software. At least 248 cells were counted per group and condition. Comparison between groups was performed by paired Student t-test.**p < 0.01; n.s., not significant. N = 3. Scale: 10 μm.
