Figure 1.

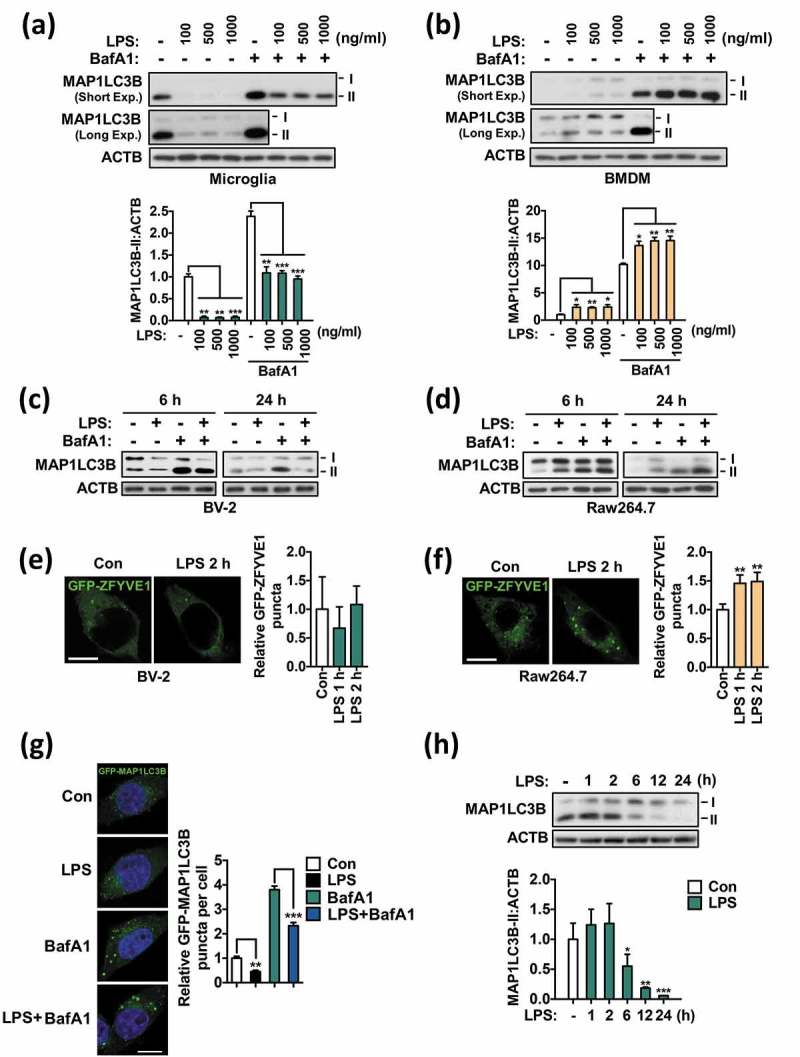
Autophagy is suppressed by LPS in microglia. (a) Analysis of autophagic flux in primary microglia after treatment with the indicated dosages of LPS for 24 h. Graph, quantification of MAP1LC3B-II after normalization to ACTB (n = 3). (b) Analysis of autophagic flux in BMDMs after treatment with the indicated dosages of LPS for 24 h. Graph, quantification of MAP1LC3-II after normalization to ACTB (n = 3). (c) Analysis of autophagic flux in BV-2 microglial cells after treatment with LPS (1 μg/mL) for 6 or 24 h. (d) Analysis of autophagic flux in Raw264.7 macrophages after treatment with LPS (1 μg/mL) for 6 and 24 h. (e) Quantification of ZFYVE1 puncta following LPS treatment in BV-2 cells (n > 30 cells per condition). (f) Quantification of ZFYVE1 puncta following LPS treatment in Raw264.7 cells (n > 40 cells per condition). (g) Quantification of GFP-MAP1LC3B puncta in BV-2 cells 24 h after LPS (1 μg/mL) treatment (n > 30 cells per condition). (h) Time course analysis of MAP1LC3B-II level in primary microglia. Cells were treated with LPS (1 μg/mL) for 1, 2, 6, 12, or 24 h. Graph, quantification of MAP1LC3B-II after normalization to ACTB (n = 4). In all experiments where BafA1 was used, BafA1 (20 nM) was added 2 h before sampling. Scale bars: 10 μm. All data are mean ± SEM. *P < 0.05, **P < 0.01, and ***P < 0.001 compared to the control (Con) unless indicated otherwise.
