Figure 4.

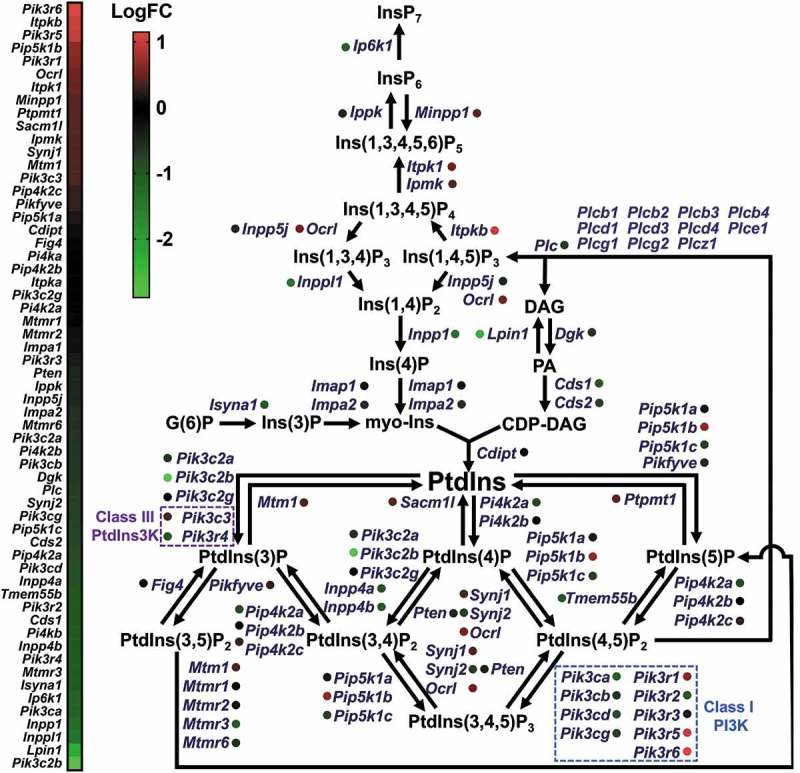
Bioinformatics analysis of RNA sequencing data for microglia activated by LPS. LogFC (fold change) values from 0 to 1 (red) indicate upregulation of gene expression and values below 0 (green) indicate downregulation.

Bioinformatics analysis of RNA sequencing data for microglia activated by LPS. LogFC (fold change) values from 0 to 1 (red) indicate upregulation of gene expression and values below 0 (green) indicate downregulation.