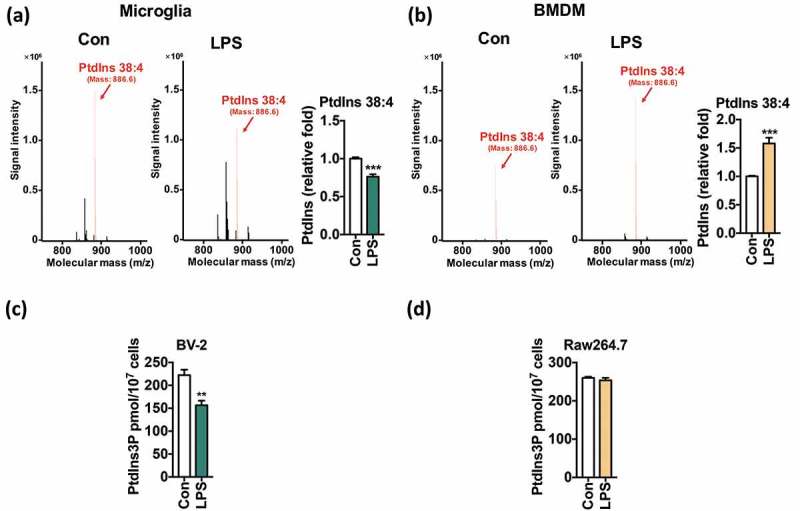
Figure 5.

LPS reduces the synthesis of PtdIns and PtdIns3P in microglia. (a, b) LC/MS metabolomics analysis of PtdIns 38:4 amounts in primary microglia (a) and BMDMs (b) 16 h after LPS (1 μg/mL) treatment. (c, d) ELISA analyses of PtdIns3P amounts in BV-2 (c) and Raw264.7 cells (d) 16 h after LPS (1 μg/mL) treatment. All data are mean ± SEM. **P < 0.01 and ***P < 0.001 compared to the control (Con).
