
Figure 7.
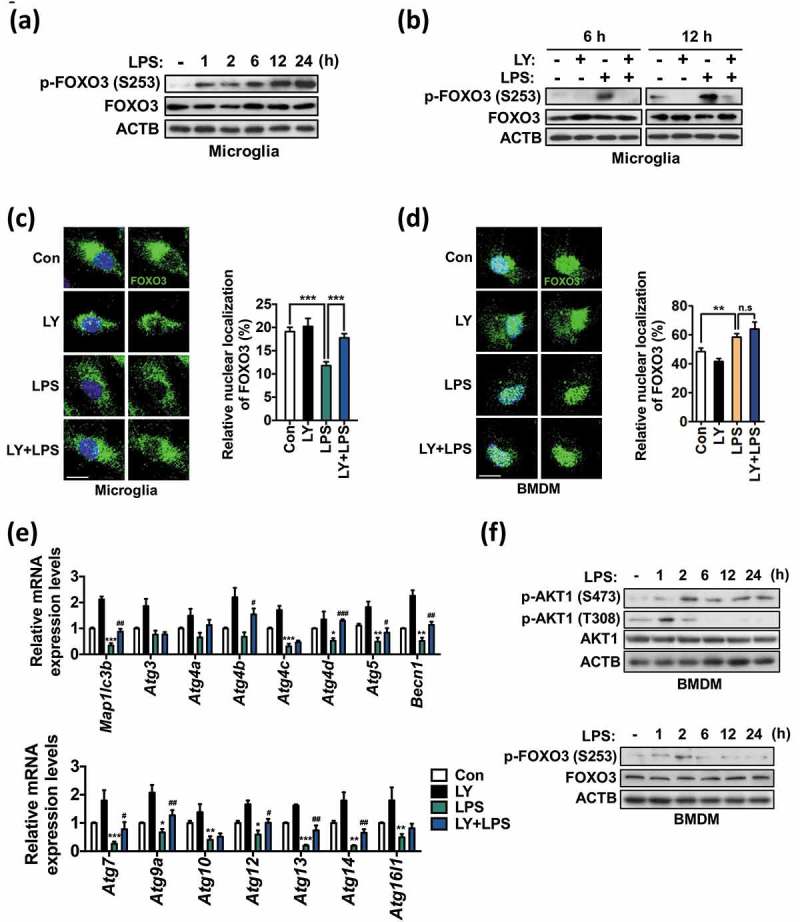
Phosphorylation of FOXO3 by PI3K-AKT1 suppresses autophagy in primary microglia. (a) Time course analysis of phosphorylation of FOXO3 (S253) in primary microglia following LPS treatment (1 μg/mL). (b) Phosphorylation of FOXO3 (S253) in primary microglia after LY294002 (LY, 20 μM) treatment at 6 and 12 h following LPS (1 μg/mL) treatment. The blots shown are representative of 3 experiments with similar results. (c, d) Analyses of nuclear localization of FOXO3 in primary microglia (n > 30 cells per condition) (c) and BMDMs (n = 30 cells per condition) (d) 12 h after LPS (1 μg/mL) treatment with 1 h pretreatment of LY (20 μM). Endogenous FOXO3 (green) was visualized by immunocytochemistry. Scale bars: 10 μm. Graphs, quantitative analysis of FOXO3 nuclear localization. (e) Analysis of the mRNA levels of Atg genes in primary microglia treated with LPS (1 μg/mL) for 12 h with 1 h pretreatment of LY (20 μM). Relative mRNA levels were quantified by qRT-PCR and normalized to ACTB (n = 3). (f) Time-course analyses of phosphorylation of FOXO3 (S253) and AKT1 (T308, S473) in BMDMs following LPS treatment (1 μg/mL). All data are mean ± SEM. n.s., not significant. *P < 0.05, **P < 0.01, and ***P < 0.001 compared to the control (Con) unless indicated otherwise. #P < 0.05, ##P < 0.01, and ###P < 0.001 compared to the LPS-treated cells.