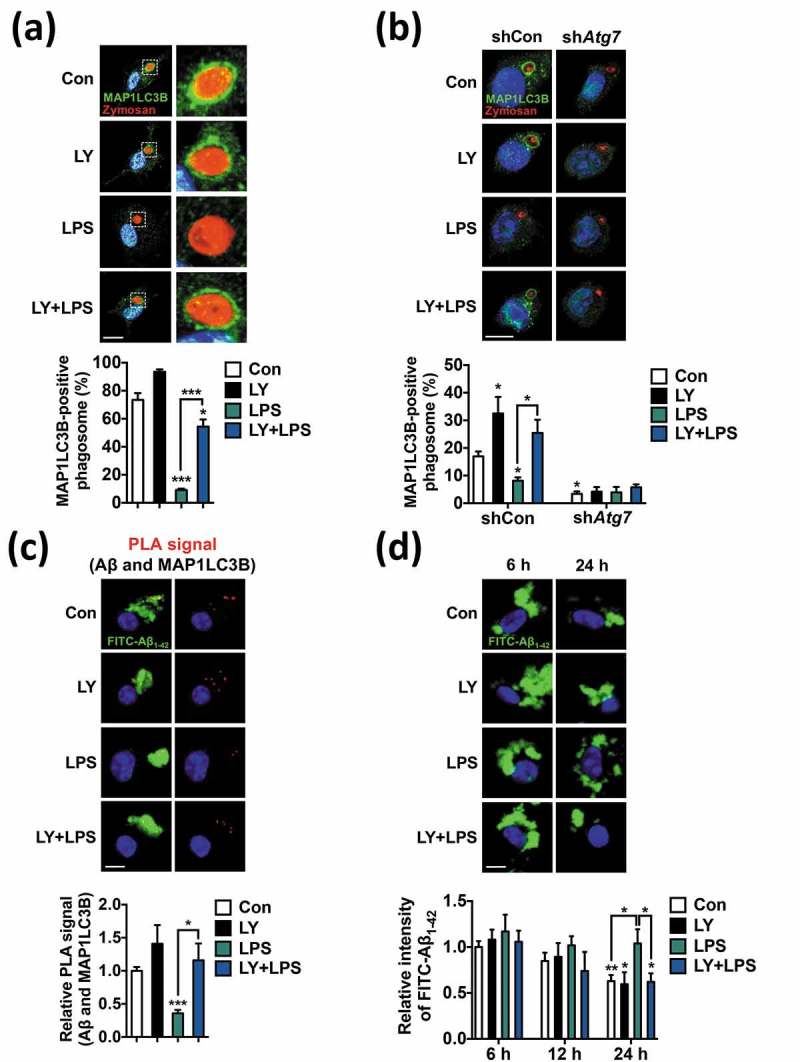
Figure 9.

LPS suppresses MAP1LC3B-associated phagocytosis (LAP) and Aβ degradation via the PI3K-AKT1 signaling pathway in microglia. (a) Analysis of LAP in primary microgliawhere stimulated with LPS (1 μg/mL) for 12 h and then incubated with zymosan for another 2 h. LY (20 μM) was added 1 h prior to LPS. Immunocytochemistry images show MAP1LC3B (green), zymosan (red), and nucleus (blue). Graph, quantitative analysis of MAP1LC3B-positive phagosomes from 3 independent experiments (n = 45 to 113 cells). (b) Analysis of LAP in Atg7 knockdown BV-2 cells (n = 35 to 63 cells). BV-2 cells were infected with lentivirus expressing Atg7-targeting (shAtg7) or control (shCon) shRNA for stable knockdown. Experimental conditions were the same as (a). (c) Analysis of PLA signal between MAP1LC3B and Aβ in primary microglia after treatment with LPS (1 µg/mL) for 12 h. LY (20 µM) was added 1 h prior to LPS treatment. Graph, quantification of PLA signal (n = 82 to 135 cells). (d) Measurement of Aβ degradation in LPS-stimulated primary microglia. FITC-conjugated Aβ1−42 fibrils were added to the cells and the fluorescence intensity of the remaining FITC-Aβ1−42 was measured using a fluorescence microscope 6, 12, or 24 h later. Graph, quantification of Aβ fibril intensities from 3 independent experiments (n = 82 to 106 cells). *P < 0.05, **P < 0.01, and ***P < 0.001 compared to the control (Con) unless indicated otherwise.
