Figure 6.

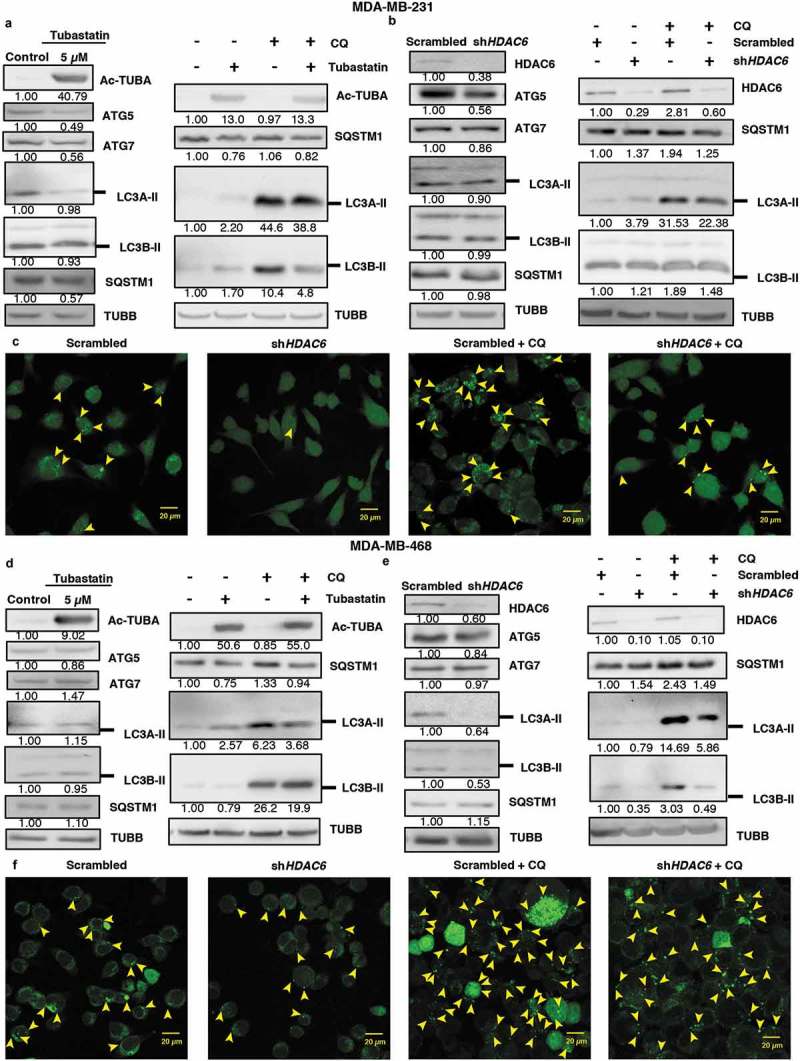
HDAC6 inhibition or KD inhibit autophagy in MDA-MB-231 and MDA-MB-468 cells. (a) MDA-MB-231 tubastatin A-treated cells were subjected to western blot analysis for ATG5, ATG7 LC3A-II, LC3B-II and SQSTM1 and treated with 18 µM chloroquine (CQ), and the levels of SQSTM1, and LC3-II were analyzed by WB analysis. (b) MDA-MB-231 HDAC6 KD cells were subjected to WB analysis for ATG5, ATG7, LC3A-II and LC3B-II and SQSTM1 and scrambled control or shHDAC6 KD cells were treated with 18 µM chloroquine (CQ) and the levels of SQSTM1, and LC3-II were analyzed by WB analysis. (c) MDA-MB-231 HDAC6 KD cells were transfected with GFP-LC3-overexpressing plasmid and treated with chloroquine (CQ) and puncta formation was analyzed by confocal microscopy. Arrowheads indicate examples of GFP-LC3 puncta. (d) MDA-MB-468 tubastatin A-treated cells were subjected to western blot analysis for ATG5, ATG7, LC3A-II, LC3B-II and SQSTM1 and treated with 18 µM chloroquine (CQ) and the levels of SQSTM1, and LC3-II were analyzed by WB analysis. (e) MDA-MB-468 HDAC6 KD cells were subjected to WB analysis for ATG5, ATG7, LC3A-II, LC3B-II and SQSTM1 and scrambled control or shHDAC6 KD cells were treated with 18 µM chloroquine (CQ) and the levels of SQSTM1, and LC3-II were analyzed by WB analysis. (f) MDA-MB-468 HDAC6 KD cells were transfected with GFP-LC3-overexpressing plasmid and treated with chloroquine (CQ) and puncta formation was analyzed by confocal microscopy.
