
Figure 3.
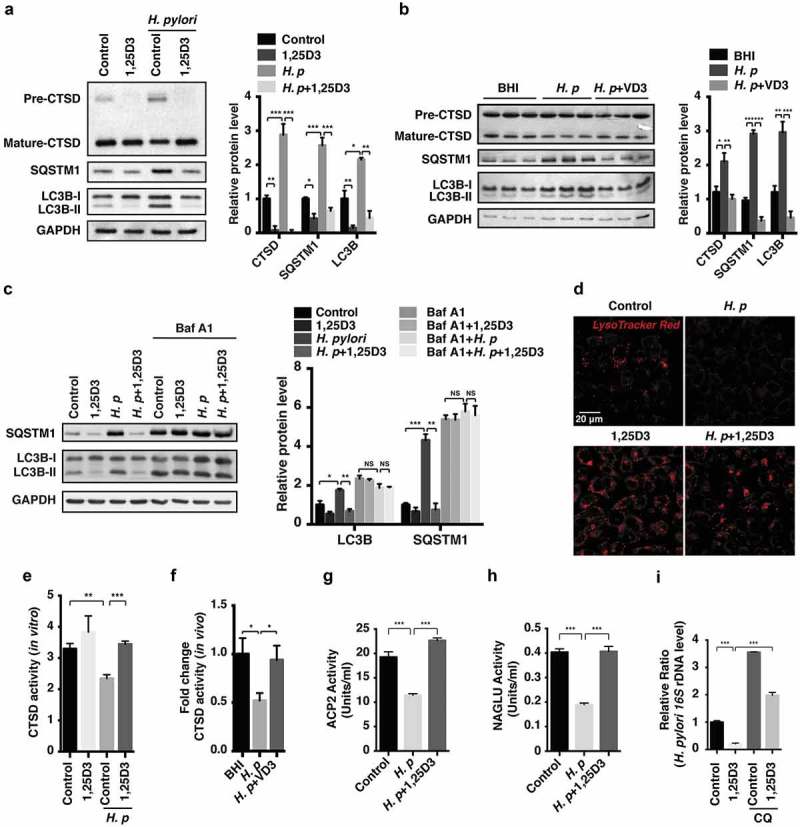
Anti-H. pylori activities of VD3 were mediated through enhancement of lysosomal degradation. (a) HFE145 cells were infected with H. pylori SS1 strain (MOI 100) and treated with 1,25D3 (200 nM, 72 h). Whole-cell lysates were examined for LC3B, SQSTM1 and CTSD protein levels. LC3B-II:LC3B-I ratio, pre-CTSD:mature-CTSD ratio and SQSTM1 protein levels were quantified. (b) C57BL/6 mice (n = 8 per group) were infected with the H. pylori SS1 strain for 1 month, and then administered with or without vitamin D3 (1000 IU/kg, intragavage) every other day for another 2 months. Stomach tissues from 3 mice from each group were randomly selected to analyze for LC3B, SQSTM1 and CTSD protein levels. LC3B-II:LC3B-I ratio, pre-CTSD:mature-CTSD ratio and SQSTM1 protein levels were quantified. (c) HFE145 cells infected with the H. pylori SS1 strain (MOI 100) were treated with 1,25D3 (200 nM) and/or Baf A1 (100 μM) for 72 h. Cell lysates were analyzed for LC3B and SQSTM1 protein levels. LC3B-II:LC3B-I ratio and SQSTM1 protein levels were quantified. (d,e) HFE145 cells were infected with or without H. pylori SS1 strain (MOI 100), and then treated with 1,25D3 (200 nM, 72 h). (d) Cells were stained with LysoTracker Red (100 nM, 30 min) to assess lysosomal activities (n = 3). Scale bar: 20 µm. (e) Whole-cell lysates from each group were examined for CTSD activity. (f) C57BL/6 mice (n = 8 per group) were infected with the H. pylori SS1 strain for 1 month, and then administered with or without VD3 (1000 IU/kg, intragavage) every other day for another 2 months. Mouse gastric tissues were harvested to examine CTSD activity. (g,h) Lysosome fractions were enriched. ACP2 (g) and NAGLU (h) activities were determined using the appropriate commercial kits. (i) HFE145 cells infected with the H. pylori SS1 strain (MOI 100) were treated with 1,25D3 (200 nM) and/or CQ (10 μM) for 72 h. Intracellular H. pylori DNA levels were measured by real-time PCR. GAPDH was used as the internal control. All the quantitative data are presented as means ± S.E.M. from 3 independent experiments. **P < 0.01; ***P < 0.001.