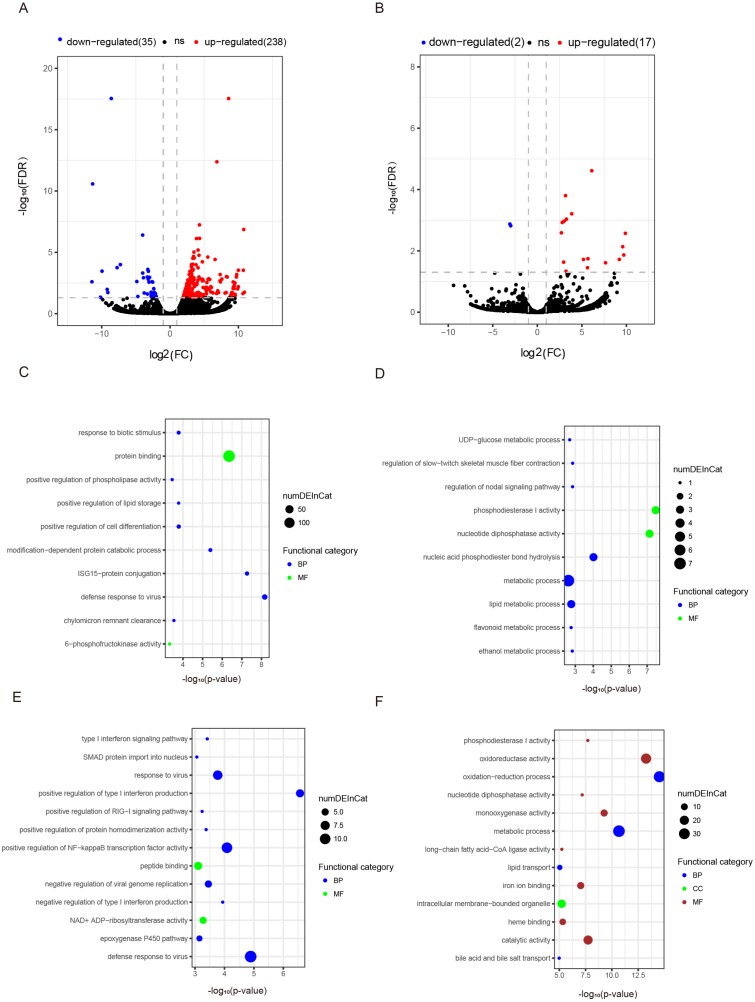
Figure 3. Differentially expressed mRNAs and lncRNAs during aging.
The q-value < 0.05 and fold change >2 were used to identify differentially expressed mRNAs and lncRNAs in OYL. Gene Ontology (GO) enrichment analyses were performed to analyze the functional enrichment of differentially expressed mRNAs and lncRNAs. (A) Differentially expressed mRNAs in OYL. (B) Differentially expressed lncRNAs in OYL. (C) Functional enrichment analysis for up-regulated mRNAs in OYL. (D) Functional enrichment analysis for down-regulated mRNAs in OYL. (E) Function enrichment analysis for the target genes of up-regulated lncRNAs in OYL. (F) Function enrichment analysis for the target genes of down-regulated lncRNAs in OYL. Only the most enriched (p < 0.05) and meaningful GO terms are presented here. OYL, old liver vs. young liver; red dots and blue dots represent up-regulated and down-regulated mRNAs during aging, respectively. FDR, false discovery rate; FC, fold change. BP, biological process; CC, cellular component; MF, molecular function.

