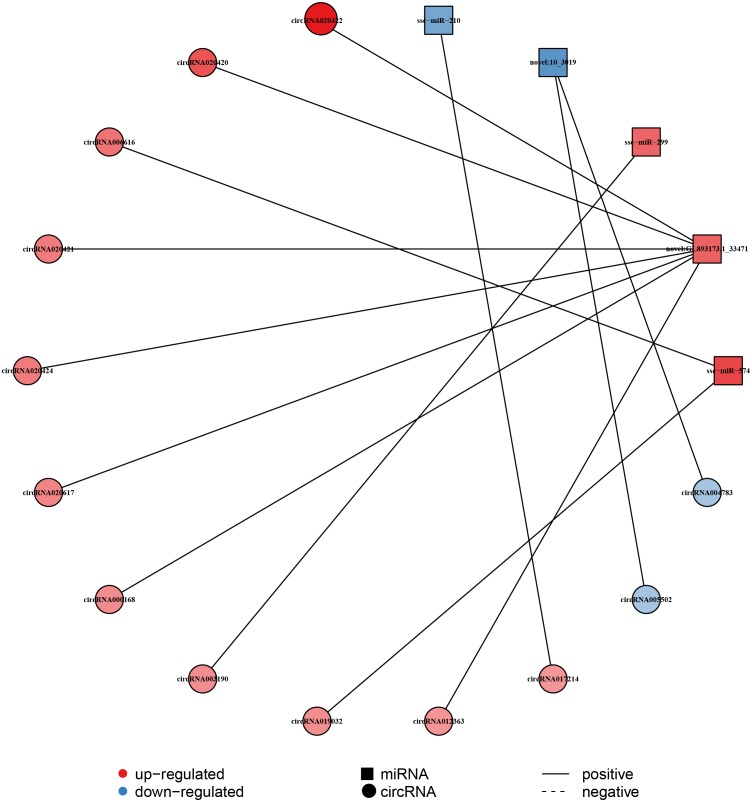
Figure 4. Construction of the circRNA-miRNA co-expression network in the liver.
The Pearson’s correlation coefficient analysis was performed between the differentially expressed circRNAs and miRNAs. r > 0.8 and p-value < 0.05 were considered relevant for the network construction between a circRNA and a miRNA. Red color and blue color represent up and down regulation, respectively. The black solid line represents a positive correlation.

