
Fig. 7.
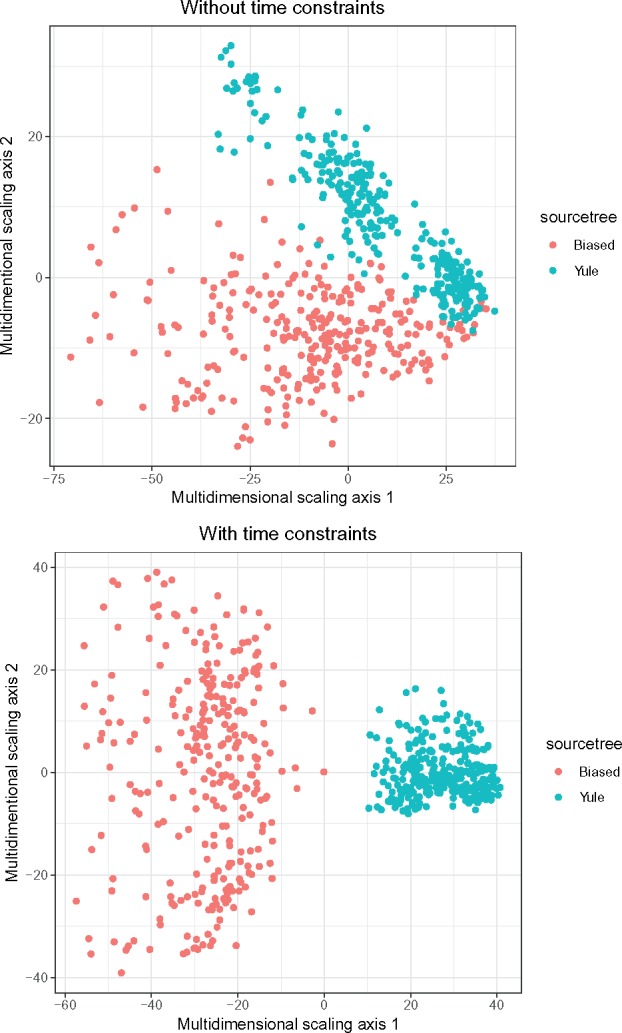
Multidimensional scaling plots visualizing distances between transmission trees sampled on the Yule and biased phylogenies, without and with restrictions on the lengths of infectious periods.
Official websites use .gov
A
.gov website belongs to an official
government organization in the United States.
Secure .gov websites use HTTPS
A lock (
) or https:// means you've safely
connected to the .gov website. Share sensitive
information only on official, secure websites.
Multidimensional scaling plots visualizing distances between transmission trees sampled on the Yule and biased phylogenies, without and with restrictions on the lengths of infectious periods.