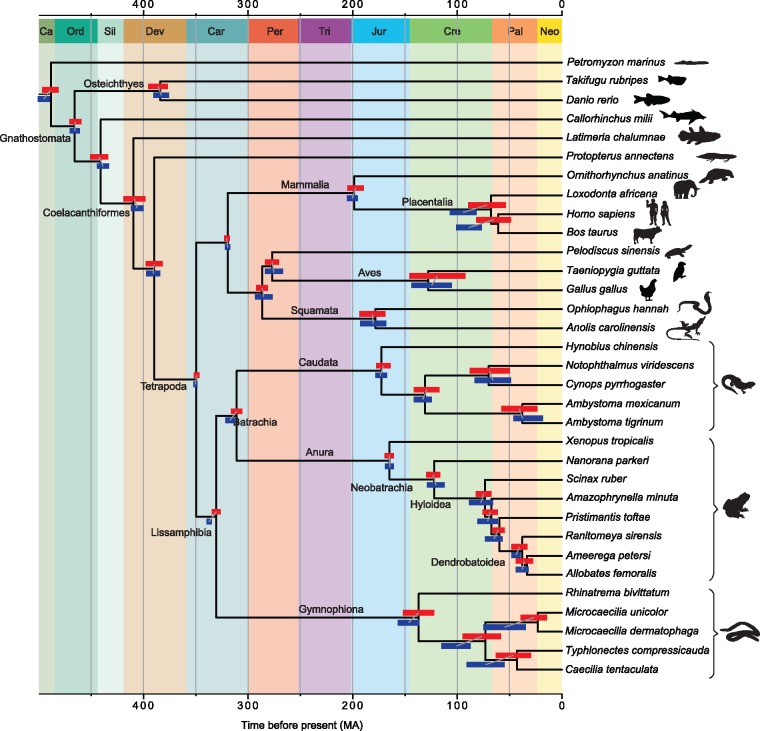
Fig. 3.
Timetree of vertebrates based on the most curated data set after enrichment for orthologs. Estimated upper and lower ranges for each node are represented as red/blue bars in each node. Red bars correspond to the divergence times estimated using Data set 348, the most curated data set. Dark blue bars correspond to the divergence times estimated using the larger Data set 768, which is before the “Clan_Check” step. Timescale in million years. Background colors for the geological time periods follow the International Commission on Stratigraphy.

