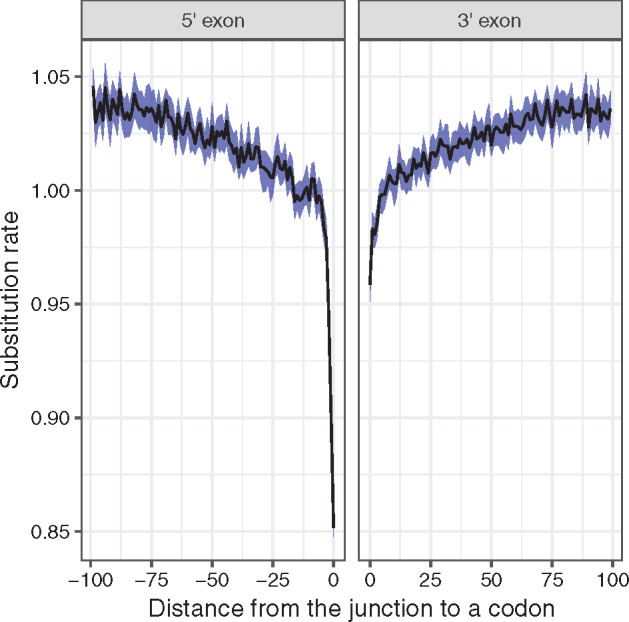
Fig. 3.

Relative substitution rate as a function of proximity to the exon–intron and intron–exon junctions in the Drosophila data set. The rates were estimated using the model M8 with codon gamma rate variation. The left panel depicts rates in 5′-exon (prior to the exon–intron junction, negative distances), whereas the right panel depicts 3′-exon (rates after the intron–exon junction, positive distances). A rate of 1 corresponds to the average rate of substitution over the gene; thus values above 1 do not indicate positive selection, but simply a rate higher than average for this gene. The blue ribbon indicates the 98% confidence interval of mean estimate. Only alignment positions with <30% of gaps were used in the plot.
