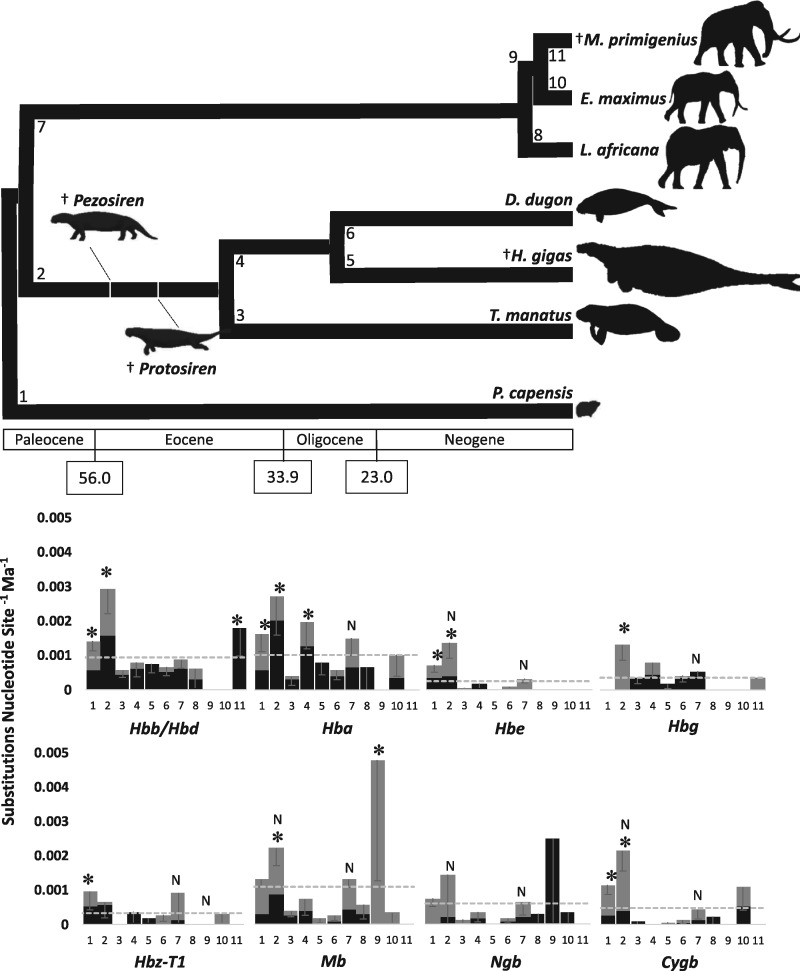
Fig. 3.
Time-calibrated phylogeny modified from Springer et al. (2015) and Rohland et al. (2007) (top panel). Column plots representing the rate of nucleotide substitutions (substitutions per nucleotide site per million years ± SE) among the eight functional globin genes of paenungulate mammals (bottom panel). Black and grey regions of each column represent the contribution of nonsynonymous and synonymous substitutions to the overall substitution rate, respectively. Column numbers correspond to specific branches in the above time-calibrated phylogeny. Asterisks denote sirenian branches that have a rate of nucleotide substitution significantly higher than the locus average (denoted by grey dotted lines). Columns marked “N” denote negative selection.

