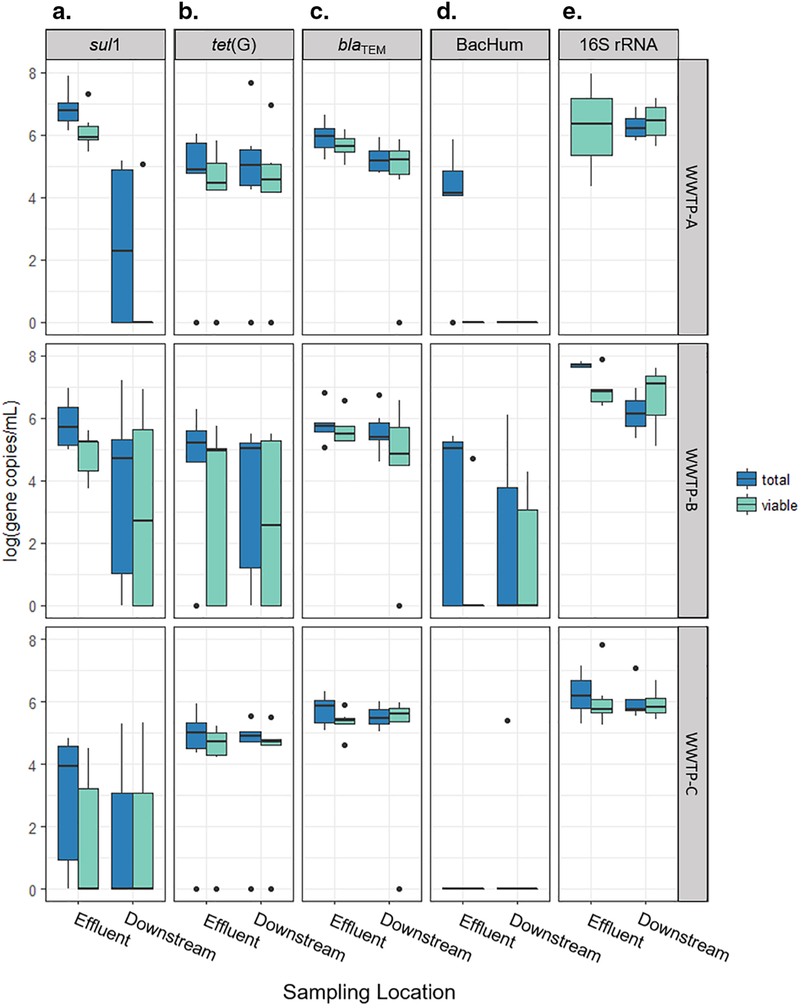
Figure 1.
Concentrations of ARGs (a.) sul1, (b.) tet(G), and (c.) blaTEM, (d.) fecal indicator marker BacHum, and (e.) 16S rRNA present overall (total) and in viable cells only (viable) measured in effluent and downstream samples from wastewater treatment plant A, B, and C during summer and winter seasons. Boxes represent upper and lower quartiles, whiskers extend to high and low data points excluding outliers, and dots indicate outliers.

