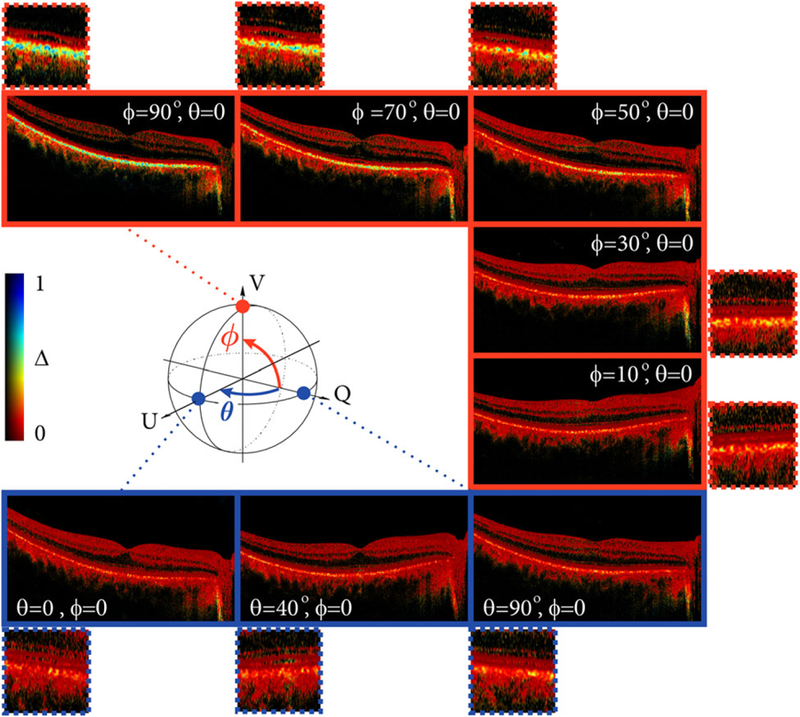
FIGURE 4.

Cross-sectional images of the fovea showing depolarization (ΔDOP = 1 − DOP). The polarization state incident at the sample was calibrated using a polarimeter at the location of the sample. The Poincaré sphere illustrates the variation of input states. The polarization states were varied from linear horizontal to linear 45° polarization (θ, blue) and from linear horizontal to circular polarization (ϕ, red)
