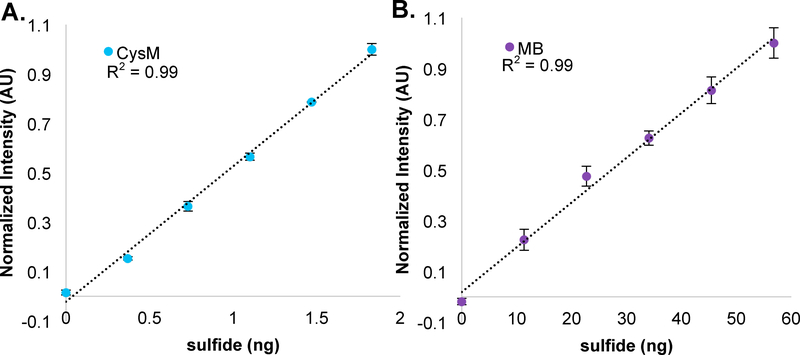
Figure 5: Comparing CysM and MB sulfide detection assays.
For each set of standards, the total amount of sulfide present in each sample was calculated and plotted versus the normalized signal intensity. A) CysM (blue spheres), or B) MB (purple spheres) assay data points were fit to a line and the slopes calculated and compared. Standards were prepared in triplicate with +/− the standard deviation represented by error bars. The CysM standards were taken from Figure 4B and the MB assay standards reported in Figure S5.

