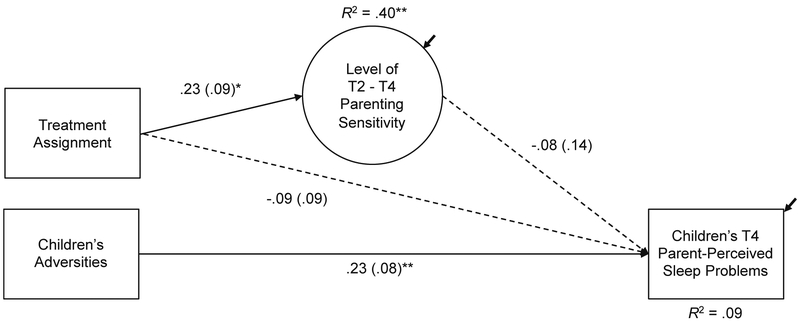
Figure 3.
Results for the hypothesized model. N = 247. Solid lines indicate significant paths. Dashed lines indicate non-significant paths. Reported are standardized path coefficients and, in parentheses, standard errors. Children’s adversities = total count of children’s adverse event exposures, higher scores indicate more adversities. Level of T2 - T4 parenting sensitivity is a latent variable representing the mean level of parenting sensitivity across all post-intervention time points, higher levels indicate more parenting sensitivity. Children’s parent-perceived sleep problems dummy coded 0 = no problem, 1 = small or very serious problem. Treatment assignment dummy coded 0 = Resource & Referral, 1 = Promoting First Relationships®. Not shown for simplicity are covariates (T1 child age, T1 parenting sensitivity, and time between T1 and T2) and observed T2 - T4 parenting sensitivity measures. T1 = baseline, T2 = immediately post-intervention, T3 = 3 months post-intervention, T4 = 6 months post-intervention.
* p < .05, ** p < .01.

