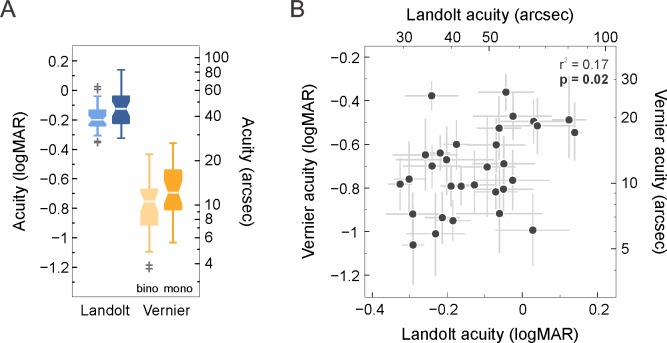
Figure 2.
Psychophysical acuity thresholds. (A) Binocular (“bino,” light) and monocular (“mono,” dark) thresholds for Landolt and Vernier acuity for all 31 subjects are shown as boxplots. Landolt and Vernier acuity values are plotted in blue and yellow, respectively. Horizontal lines signify medians, the edges of the box are the first and third quartile [interquartile range (IQR)], notches display the 95% confidence interval of the median and whiskers extend to the most extreme data points without outliers (>1.5 IQR), which are shown with individual cross markers. Monocular and binocular thresholds for Landolt and Vernier acuity differ significantly (t test, p ≪ 0.001). (B) Vernier acuity thresholds plotted against Landolt acuity thresholds of all right eyes. The gray error bars represent the standard deviations of threshold estimates between the consecutive measurements. The two metrics are significantly positively correlated (r2 = 0.17, p = 0.02).

