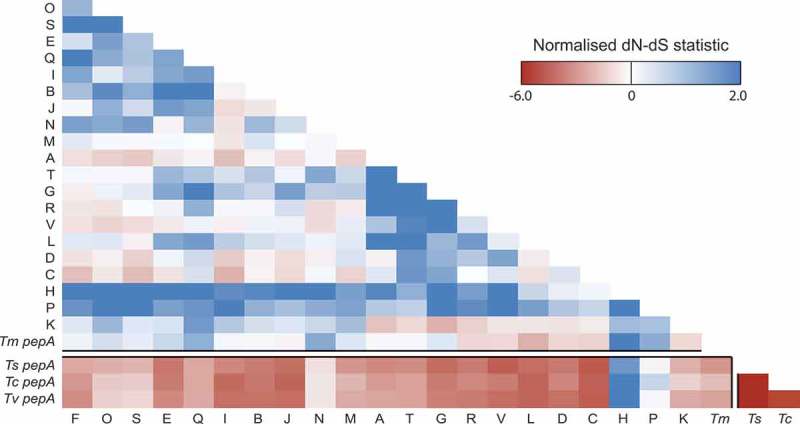
Figure 3.

Both positive and negative selection is evident amongst the aspartyl protease-encoding genes.
A heatmap showing the normalized non-synonymous/synonymous selection test statistic in pairwise comparison between all pop genes and pepA Talaromycete orthologues. The axes show the gene identifier (as a one letter abbreviation) for each T. marneffei pop gene or the species for each pepA gene (Tm, T. marneffei; Ts, T. stipitatus; Tc, T. cellulolyticus; Tv, T. verruculosus). Negative values suggest purifying selection is operating while positive values indicate relaxed selection.
