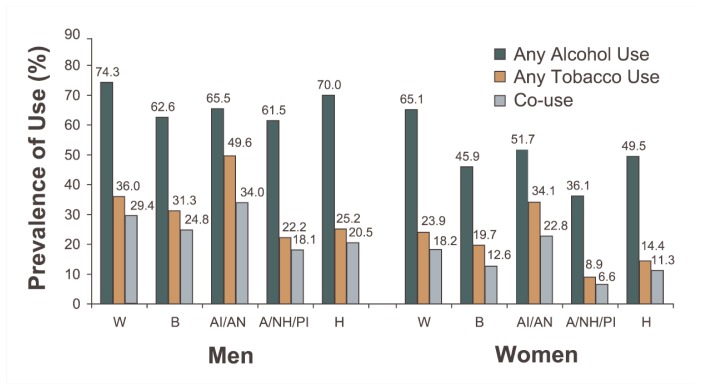
Figure 1c.
Prevalence of past-year alcohol use, tobacco use, and co-use by race/ethnicity and gender in the United States, 2001–2002 NESARC.
NOTE: Data are drawn from Table 1. W = White; B = Black; AI/AN = American Indian/Alaskan Native; A/NH/PI = Asian/Native Hawaiian/Pacific Islander; H = Hispanic.

