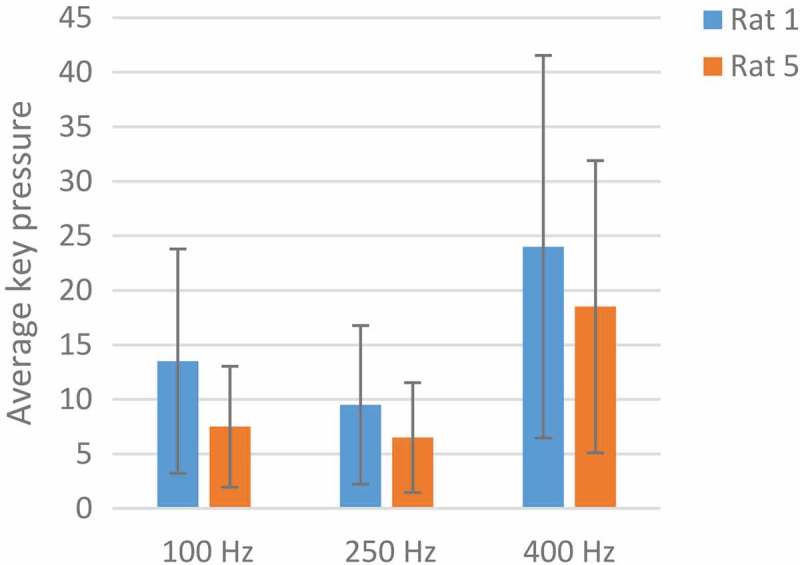
Figure 6.

An analysis of the optimum frequency. The blue color indicates Rat No. 1 and the orange color indicates the Rat No 5 at three frequencies of 100, 250, and 400 Hz. The average key pressure in both rats dropped at 250 Hz, rising again at 400 Hz. The best response to stimulation was at 400 Hz.
