
Figure 1.
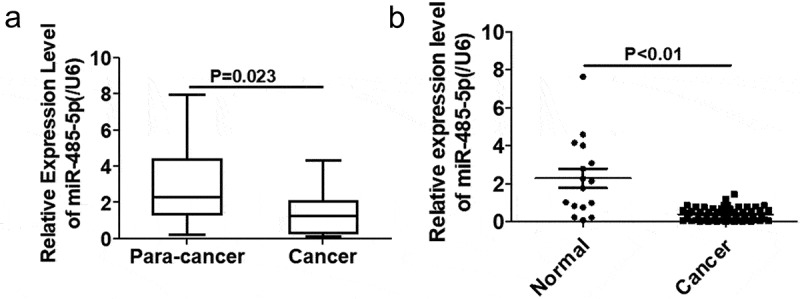
MiR-485–5p expression in SCLC tissues. (a). Comparison of the expression levels of miR-485-5p between SCLC tissues and the adjacent normal tissues. The expression levels of miR-485-5p in the SCLC tissues and the corresponding adjacent normal tissues from SCLC patients were detected by RT-qPCR using β-actin mRNA as an internal standard (n = 18). (b). Comparison of the expression levels of miR-485-5p between SCLC tissues from patients (n = 18) and normal tissues from healthy people (n = 56). miR-485-5p levels were detected by RT-qPCR using U6 RNA as an internal standard (p<0.01). Values were expressed as mean ± SD.