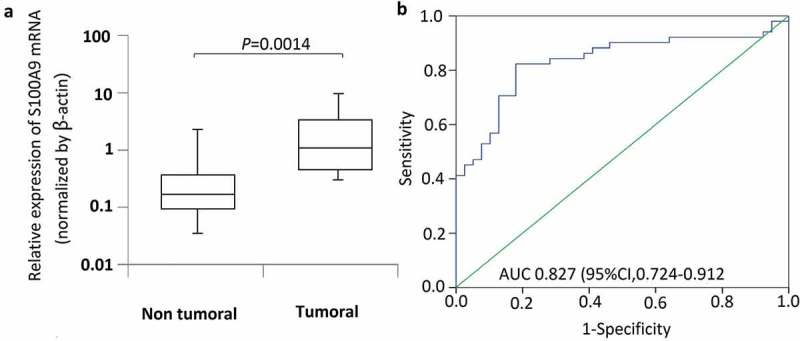
Figure 1.

S100A9 mRNA levels in 56 osteosarcoma tissues and 39 normal bone tissue samples. The relative expression level of S100A9 was normalized to b-actin. (a) Box plot of S100A9 expression levels in osteosarcoma tissues and normal bone tissues. The boxes indicate the 25th and 75th percentiles, and the bold lines represent the median values. The relative expression levels of S100A9 were normalized to b-actin. Statistically significant differences were determined using Mann–Whitney tests or Kruskal–Wallis tests. B. Receiver operating characteristics (ROC) curve analysis of the diagnostic value of S100A9.
