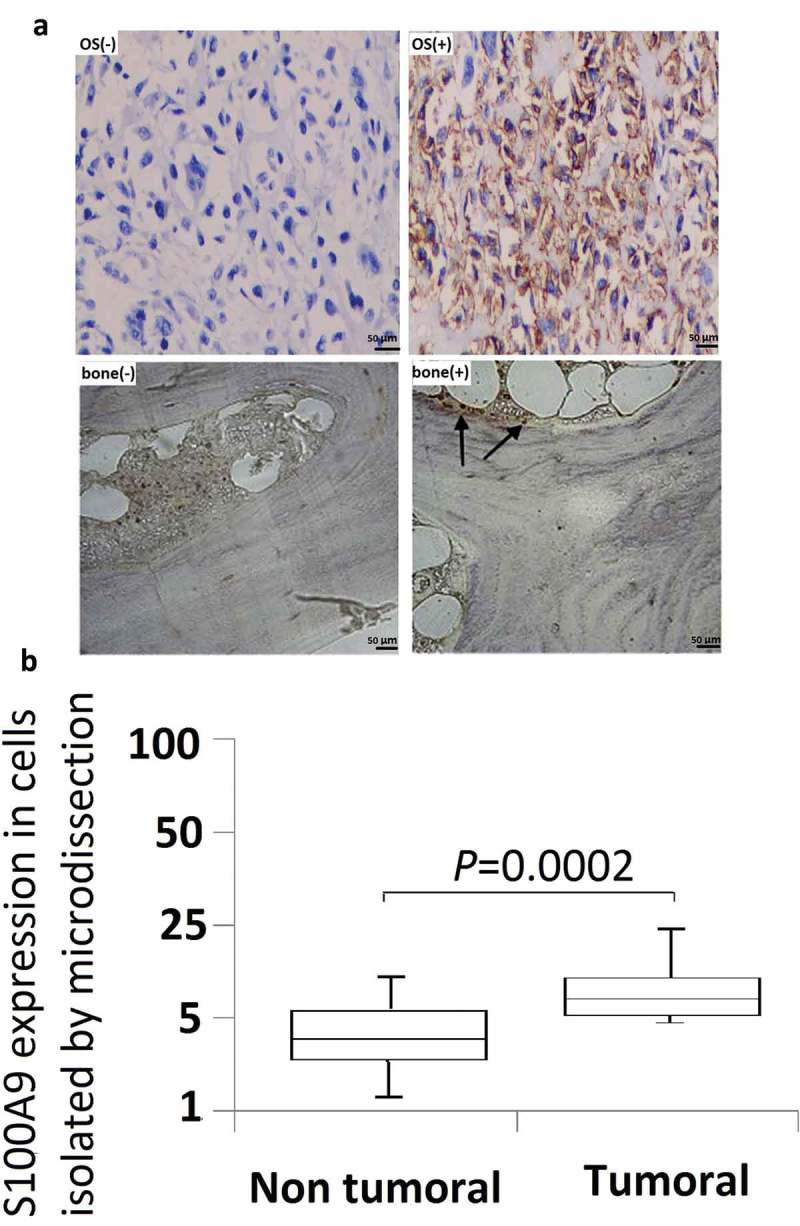
Figure 2.

Immunohistochemistry studies and microdissection-based quantitative analysis of S100A9. (a) Immunoreactivities of S100A9; representative images of positive and negative S100A9 expression in normal bone tissues; representative images of positive and negative S100A9 expression in OS tissues. Original magnification, × 200. (b) A microdissection technique was used to isolate normal bone tissues and OS tissues from frozen sections, and total RNA extracted from these cells was subjected to quantitative analysis of S100A9 mRNA using real-time PCR. Differential expression of S100A9 mRNA was observed between normal bone tissues and OS tissues (P = 0.0002).
