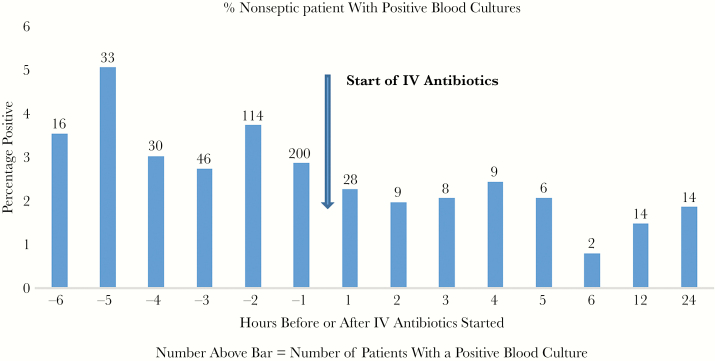
Figure 2.
The bar graph shows the percentage of nonseptic patients with positive blood cultures for each hour before starting antibiotics, for each hour after (up to 6 hours), and for 6–12 and 12–24 hours. The actual number of patients with positive blood cultures is shown above the bar. The arrow indicates the start of intravenous (IV) antibiotics.

