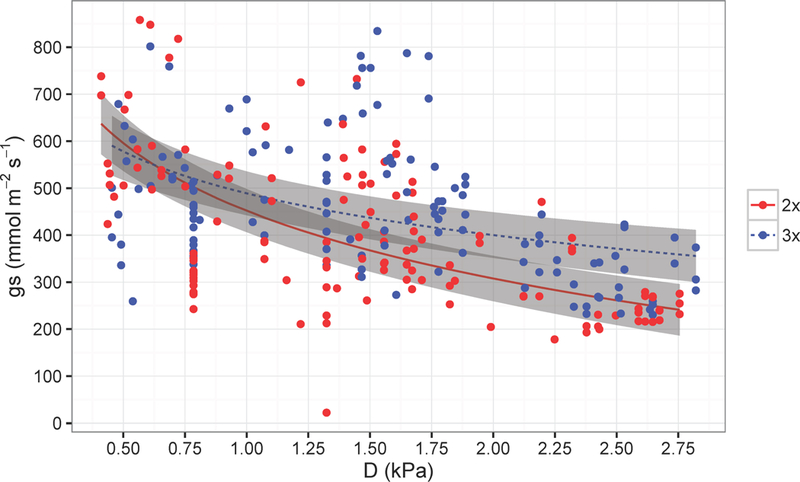
Figure 3.

Stomatal conductance (gs) as a function of vapor pressure deficit (D). The lines represent the predicted gs as a function of D from the mixed model and the grey boxes represent standard errors around predictions (2x is diploid and 3x is triploid).
