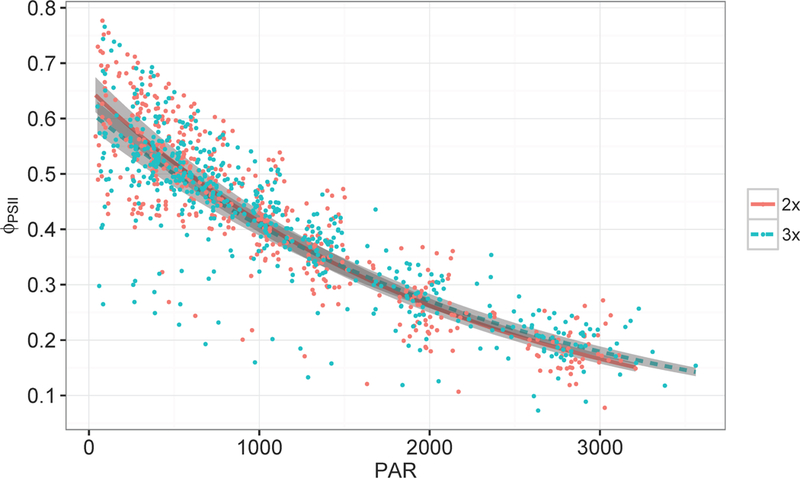
Figure 4.

ΦPSII as a function of PAR for diploid and triploid aspen measured in RLCs. The lines represent diploid and triploid predictions of ΦPSII relative to PAR and the grey boxes represent standard errors around the predictions (2x is diploid and 3x is triploid).
