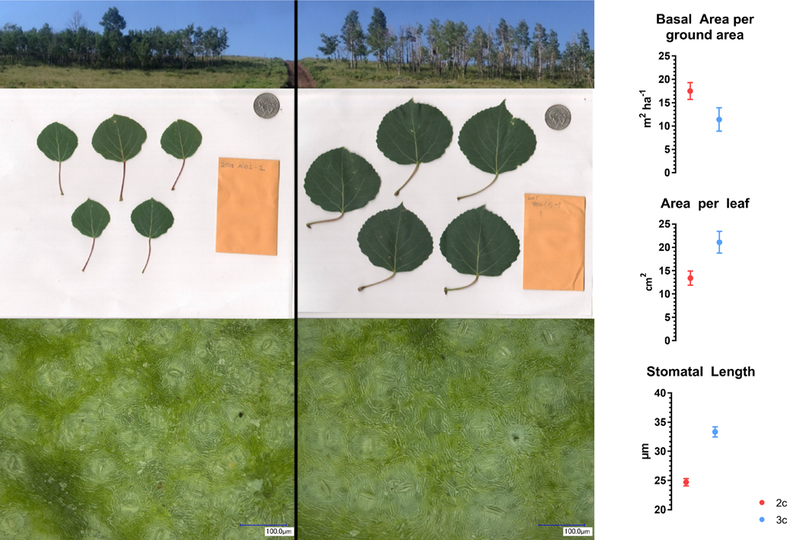
Figure 5.

Images from two adjacent clones in the Almont site show clear differences between diploid (left) and triploid (right) characteristics. Stand density (top), leaf size (middle), and stomatal size (bottom) were all statistically different between ploidy types. Scale bar in bottom row images is 100 μm. Plots depict diploid and triploid means and standard errors (also see Tables 1 and 2).
