
Figure 2.
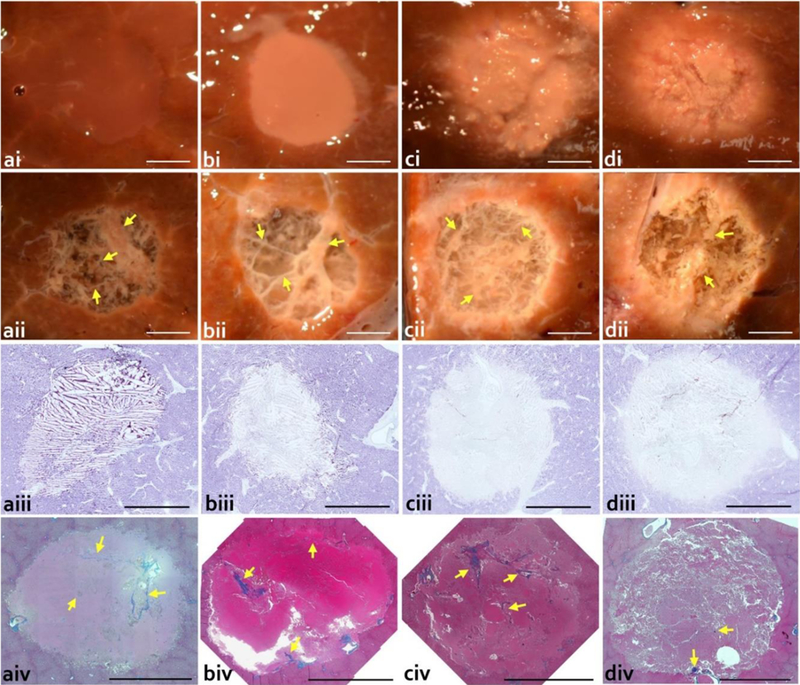
Gross and histological evaluation of the volumetric lesions produced at the lower acoustic output power of 250 W, with pulse duration of 10 ms and varying duty cycle: a) 1%; b) 3%; c) 5%; d) 10%. Upper rows show photos of lesions in cross-section i) before and ii) after rinsing the contents out. Rinsed lesions reveal connective tissue (yellow arrow) that was not liquefied by the treatment. Higher duty cycle lesions show a blanched border surrounding the lesion. NADH-diaphorase stained sections (iii) reveal minimal thermal denaturation at a) 1% duty cycle; some thermal denaturation at b) 3% duty cycle; and almost complete thermal denaturation at the c) 5% and d) 10% duty cycles. Massons trichrome stained histological sections (iv) confirm the presence of connective tissue appearing in the native state within the lesions (yellow arrow). Scale bar represents 5 mm.